
Effect of Paper Color on Students - PowerPoint PPT Presentation
Title:
Effect of Paper Color on Students
Description:
Effect of Paper Color on Students Physics Exam Performances David R. Schmidt, Todd G. Ruskell, and Patrick B. Kohl Discussion & Conclusion All results were null. – PowerPoint PPT presentation
Number of Views:46
Avg rating:3.0/5.0
Title: Effect of Paper Color on Students
1
Effect of Paper Color on Students Physics Exam
Performances
David R. Schmidt, Todd G. Ruskell, and Patrick B.
Kohl
Performance
Exam I Exam I Exam II Exam II Exam III Exam III
F Ratio p-value F Ratio p-value F Ratio p-value
Total Score F(3,314)0.86 p0.454 F(3,409)0.47 p0.702 F(3,395)0.80 p0.497
Multiple Choice F(3,314)1.21 p0.306 F(3,409)0.48 p0.698 F(3,395)0.73 p0.536
Free Response F(3,314)0.27 p0.265 F(3,409)0.19 p0.902 F(3,395)1.53 p0.206
Conceptual F(3,314)0.84 p0.836 F(3,409)0.33 p0.327 F(3,395)0.85 p0.849
Mathematical F(3,314)0.18 p0.178 F(3,409)0.64 p0.592 F(3,395)0.43 p0.731
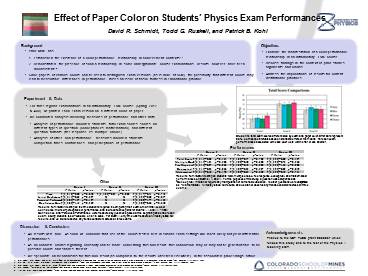
Results from ANOVA testing on students total,
multiple choice, free response, conceptual, and
mathematical performances on Exams I, II, and
III. For the purposes of this study, a question
was categorized as Conceptual if it did not
require any manipulation or numerical evaluation.
All other questions were categorized as
Mathematical. All tests yielded null results,
and we did not observe any trends consistent
across all three exams.
Other
Exam I Exam I Exam II Exam II Exam III Exam III
F Ratio p-value F Ratio p-value F Ratio p-value
Time F(3,212)2.68 p0.048 F(3,405)2.24 p0.083 F(3,317)0.41 p0.745
Initial Confidence F(3,314)0.63 p0.597 X X F(3,393)2.68 p0.047
Perceived Performance F(3,303)1.57 p0.197 X X F(3,382)1.77 p0.153
Confidence Gain F(3,303)1.13 p0.339 X X F(3,382)0.56 p0.640
Results from ANOVA testing on the time students
required in completing their exams, their initial
levels of confidence, their self-perceptions of
performance, and their confidence gains for Exams
I, II, and III. Initial Confidence and
Perceived Performance were measured by
questions placed at the beginning and end of each
exam asking students to self-evaluate on a 1-5
scale. For Exam II, only time was measured. All
tests yielded null results, and we did not
observe any trends consistent across all three
exams.
- A.S. Soldat, R.C. Sinclair, and M.M. Mark, Color
as an environmental processing cue External
affective cues can directly affect processing
strategy without affecting mood, Soc. Cognition
15(1), 55-71, 1997. - A.J. Elliot, M.A. Maier, A.C. Moller, R.
Friedman, and J. Meinhardt, Color and
psychological functioning The effect of red on
performance attainment, J. Exp. Psychol. Gen.
136(1), 154168, 2007. - R.C. Sinclair, A.S. Soldat, and M.M. Mark,
Affective cues and processing strategy
Color-coded examination forms influence
performance, Teach. Psychol. 25(2), 130-132,
1998. - N.F. Skinner, Differential test performance from
differently colored paper White paper works
best, Teach. Psychol., 31(2), 111112, 2004. - I.R. Tal, K.G. Akers, and G.K. Hodge, Effect of
paper color and question order on exam
performance, Teach. Psychol. 35(1), 26-28, 2008.
Recommended
CrystalGraphics Presentations


