
The graph is a hoirzontal line. Velocity is zero. - PowerPoint PPT Presentation
Title:
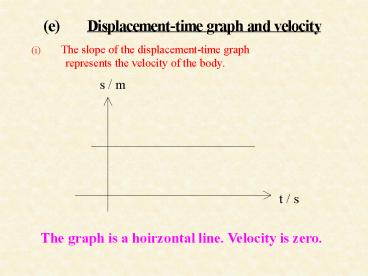
The graph is a hoirzontal line. Velocity is zero.
Description:
The graph is a hoirzontal line. Velocity is zero. The slope 0 (positive). The object is moving towards the end position The slope – PowerPoint PPT presentation
Number of Views:50
Avg rating:3.0/5.0
Title: The graph is a hoirzontal line. Velocity is zero.
1
The graph is a hoirzontal line. Velocity is zero.
2
The slope gt 0 (positive). The object is moving
towards the end position
3
The slope lt0 (negative). The object is moving
towards the start position
4
Speed or velocity is at middle instant of the
time interval.
5
Constructing Speed time graph or velocity time
graph
6
(No Transcript)
7
Construct from a distance-time graph (or a
displacement-time graph)
8
Displacement and v-t graph
- The following slides show you the relationship
between displacement (S) and the v-t graph
(velocity-time graph)
9
area under the graph?
Graph
area under the graph from t 0.1s to 0.2s is the
distance travelled during t0.1s to 0.2s
Area 0.6 x (0.2- 0.1) Area speed x time
distance
10
Displacement travelled by the object from time
t1 to t2 area A
V1
11
The area under v-t graph
Displacement due to the increase of velocity
from v1 to v2 from t1 to t2
Displacement due to v1 from t1 to t2
12
(No Transcript)
13
(No Transcript)
14
(No Transcript)
15
(No Transcript)
16
y mx
17
(No Transcript)
18
(No Transcript)
19
(No Transcript)
20
no s
no v
no a
no t
21
u ,
v ,
a
s
can be or -
depend on direction
22
Case 1
t 3s
u 1ms-1
v 4ms-1
a ?
Case 2
t 5s
v - 4ms-1
u 1ms-1
23
(No Transcript)
24
(No Transcript)
25
(No Transcript)
26
(No Transcript)
27
(No Transcript)
28
(No Transcript)
29
(No Transcript)
30
(No Transcript)
31
(No Transcript)
32
(No Transcript)
33
(No Transcript)
34
(No Transcript)
35
(No Transcript)
Recommended
CrystalGraphics Presentations


