
Teacher Note: Module 2 Overview - PowerPoint PPT Presentation
Title:
Teacher Note: Module 2 Overview
Description:
Core Concepts: Testing hypotheses Association Exposure/outcome Control group 2x2 table Observational studies Study design/study plan Study samples Prevalence rate – PowerPoint PPT presentation
Number of Views:70
Avg rating:3.0/5.0
Title: Teacher Note: Module 2 Overview
1
Teacher Note Module 2
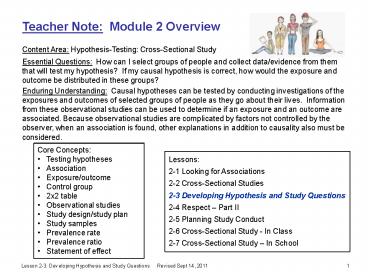
Overview Content Area Hypothesis-Testing
Cross-Sectional Study Essential Questions How
can I select groups of people and collect
data/evidence from them that will test my
hypothesis? If my causal hypothesis is correct,
how would the exposure and outcome be distributed
in these groups? Enduring Understanding
Causal hypotheses can be tested by conducting
investigations of the exposures and outcomes of
selected groups of people as they go about their
lives. Information from these observational
studies can be used to determine if an exposure
and an outcome are associated. Because
observational studies are complicated by factors
not controlled by the observer, when an
association is found, other explanations in
addition to causality also must be considered.
- Core Concepts
- Testing hypotheses
- Association
- Exposure/outcome
- Control group
- 2x2 table
- Observational studies
- Study design/study plan
- Study samples
- Prevalence rate
- Prevalence ratio
- Statement of effect
Lessons 2-1 Looking for Associations 2-2
Cross-Sectional Studies 2-3 Developing Hypothesis
and Study Questions 2-4 Respect Part II 2-5
Planning Study Conduct 2-6 Cross-Sectional Study
- In Class 2-7 Cross-Sectional Study In School
Revised Sept 14, 2011
2
Teacher Note Enduring Epidemiological
Understandings for the Epidemiology and the
Energy Balance Equation Curriculum
- Health and disease are not distributed
haphazardly in a population. There are patterns
to their occurrence that can be identified
through surveillance. Analysis of the patterns
of health and disease distribution can provide
clues for formulating hypotheses about their
possible causes. - Causal hypotheses can be tested by conducting
investigations of the exposures and outcomes of
selected groups of people as they go about their
lives. Information from these observational
studies can be used to determine if an exposure
and an outcome are associated. Because
observational studies are complicated by factors
not controlled by the observer, other
explanations also must be considered.
3
Teacher Note Authentic Assessment for Module 2
of the Epidemiology and the Energy Balance
Equation Curriculum
Students will conduct, analyze, and interpret
observational, cross-sectional studies among
students in their class and then among students
outside their class. Working in teams, students
will have the opportunity to demonstrate their
abilities to select a reasonable hypothesis of
interest to them, design study questions about
exposure and outcome, obtain informed consent,
collect and manage data, calculate and compare
prevalence rates, make accurate statements about
whether their data support that hypothesis, and
consider alternate explanations for what they
observed. Reporting of results will be required,
such as a written report, an item for the school
newspaper, or an oral presentation or poster for
students, teachers, and/or parents. Specific
performance criteria will be used to help ensure
that the experiences allow a genuine, realistic,
and fair assessment of students comprehension of
the Module 2 Enduring Epidemiological
Understanding.
4
Teacher Note Photos of Worksheets for Lesson
2-3
2-3a
2-3b
2-3c
2-3d
5
Start of Lesson 2-3 (estimate 2 class periods)
6
Review
- Big Ideas in Lesson 2-2
- The cross-sectional design is an observational
study
of a natural experiment - This design is relatively quick and simple,
asking individuals about exposure and outcome at
one point in time - After the prevalence is calculated for the group
with the exposure, the next question is compared
to what? - The compared to what consists of prevalence for
the unexposed controls - Dividing one prevalence by the other produces
the prevalence ratio it tells us if/how the
exposure and outcome are associated - Because exposure and outcome are measured at the
same point in time, it is usually not possible to
determine the time order of the exposure and the
outcome (which came first) and as such, the
association may not be interpretable
7
Overview of Lesson 2-3
8
2-3a
Checklist - Study Planning Components
and Expectations
2-3 Study Hypothesis - Statement of a hypothesized association between an exposure and an outcome
2-3 Study Variables - Developing questions about exposure and outcome , and additional questions about participants
2-3 Questionnaire - Preparing a one-page sheet that study participants will fill out (typed and copies made)
2-4 Draft Informed Consent Script - Preparing a script to be read to possible study participants (typed and copies made)
2-5 Plans for Study Conduct Having assignments for study day
9
Part of 2-3a
Expectations for Successful Completion
of Activities in
Lesson 2-3
Study Plan Component Met Some-what Met Not Met
2-3 Study Hypothesis - Statement of a hypothesized association between an exposure and an outcome 1) Stated clearly 2) makes sense at face value and 3) is feasible to study in a school setting ? ? ?
2-3 Study Variables - Developing questions about exposure and outcome 1) Clear questions that will mean the same thing to anyone who reads it 2) a good description of what you are trying to measure 3) a good understanding of challenges in measurement and 4) an awareness of other information about study participants that will help in understanding study results
2-3 Questionnaire - Preparing a one-page sheet that study participants will fill out (typed and copies made) Format of the survey that is user-friendly and clear in presenting questions and answer options and instructions
10
Hypotheses
An educated guess
A tentative explanation
An unproven idea, based on observation or
reasoning, that can be supported or refuted
through investigation
11
Hypotheses?
12
Hypotheses?
13
Tips
- Your hypothesis statement should state the
hypothesized relationship between an exposure
variable and an outcome variable, including the
direction expected. - Make sure that the hypothesis you choose is of
genuine interest to you, because you will be
spending your time and energy exploring
it. - Your stated hypothesis MUST NOT require the
collection of any information that might be
considered embarrassing, sensitive, or illegal. - The hypothesis needs to be related to nutrition
and/or physical activity.
14
Examples of Variables to Use in a Hypothesis
- Eat school cafeteria food
- Regularly watch TV
- Have a sedentary lifestyle
- Have a high-fat diet
- Take multivitamins
- Eat breakfast
- Have perception of overweight
- Have good academic performance
- Regularly play computer games
- Eat junk food every day
- Have a low-fat diet
- Regularly exercise
- Participate in a team sport
- Eat fruits and vegetables
- Drink high calorie drinks
- Drink diet soda
- Walk to school
- Get a good nights rest
- Other ? ? ?
15
Some variables can be an exposure or an outcome
When is eating more fruits and vegetables an
exposure? When is eating more fruits and
vegetables an outcome? Examples of
Hypotheses - People who eat more fruits and
vegetables take more multivitamins - People who
rarely watch TV are more likely to eat fruits and
vegetables When is having more physical
activity an exposure? When is having more
physical activity an outcome? Examples of
Hypotheses - Physical activity is associated
with a longer nights sleep - People with high
academic performance are more likely to also
have more physical activity
16
2-3b
How do I state a hypothesis?
Study Hypothesis
X is associated with Y People with X are more
likely to have Y People with X have higher, or
more Y
Why is your study team interested in testing this
hypothesis? Discuss the reason(s) your team
thinks it will be possible to
test this hypothesis in your class and school.
17
2-3b
Study Hypothesis
- Eat school cafeteria food
- Regularly watch TV
- Have a sedentary lifestyle
- Have a high-fat diet
- Take multivitamins
- Eat breakfast
- Have perception of overweight
- Have good academic performance
- Regularly play computer games
- Eat junk food every day
- Have a low-fat diet
- Regularly exercise
- Participate in a team sport
- Eat fruits and vegetables
- Drink high calorie drinks
- Drink diet soda
- Walk to school
- Get a good nights rest
- Other ? ? ?
18
A few examples of hypotheses to test
- Students who drink caffeinated drinks do more
homework after school. - Students who drink caffeinated drinks get less
sleep. - Healthy eating (at least 2 servings of fruit and
vegetables a day) results in better grades
(doing well in school. - Students that regularly eat vegetables have
fewer periods of illness (24 hours or more of
flu/cold symptoms). - Students who eat breakfast have fewer colds and
therefore have fewer absences from school. - A healthy breakfast is associated with playing
in an organized sport. - Students who eat dinner with their family more
often get better grades. - Students who skip lunch will eat more snacks.
- People who eat more fruits and vegetables take
more multivitamins. - Drinking more water is associated with eating
more fruits and vegetables. - Students who drink more sweetened drinks are
more likely to eat unhealthy snacks. - Drinking at least 2 cans or a 20 ounce bottle of
non-diet soda per day leads to a crash (feeling
tired).
OPTIONAL SLIDE TO SHOW STUDENTS
19
A few examples of hypotheses to test
- Students who have one or more cats or dogs are
more physically active. - Students who have one or more cats or dogs have
more school absences due to colds. - Receiving a daily, weekly, or monthly allowance
is related to eating junk food/unhealthy food
more than twice a day. - Students who chew gum eat fewer snacks.
- Students who listen to an IPOD are more likely
to participate in physical activity. - Students who text more are less physically
active. - Watching more TV is associated with having lower
stress levels. - Students who watch TV eat more snacks.
- Students who regularly play video games eat more
snacks. - Students who play regular video games (not
active) eat more junk food. - Playing active video games is related to getting
better grades. - Student athletes, on average, get more sleep
than students who do not participate in a sport.
OPTIONAL SLIDE TO SHOW STUDENTS
20
A few examples of hypotheses to test
- Students who participate in sports are more
satisfied with their lives - Physical activity is associated with eating less
junk food. - People who participate in a team sport are more
likely to eat fruits and vegetables. - Physically active students place greater weight
on the importance of a healthy lifestyle. - Regular exercise is related to higher academic
performance. - Students who get 8 or more hours of sleep on
average have higher academic performance. - Students who sleep lt8 hours a night eat more
often than those who get at least 8 hours of
sleep. - Students who have less parental supervision are
more likely to watch TV. - Students who have less parental supervision eat
more junk food for after school snacks. - High academic performance is associated with more
physical activity. - High academic performance is associated with a
healthy diet.
OPTIONAL SLIDE TO SHOW STUDENTS
21
Possible break point between class periods
22
More Information about CHIS Study
- Theresa A. Hastert, Susan H. Babey. School lunch
source and adolescent dietary behavior.
Prevention of Chronic Diseases 2009, Vol 6 (4). - http//www.cdc.gov/pcd/issues/2009/oct/08_0182.htm
23
Review Criteria for a Good Question
- It should be clear and unambiguous, written so
that its intended audience understands it. - It should mean the same thing to everyone who
reads it. - The answer options must categorize and cover the
entire range of possible behavior (from complete
absence of the behavior to a maximum amount of
the behavior). - The time period to consider when answering a
particular question must be appropriate (long or
short enough) to capture the frequency of
behavior desired (depending on the information
desired and the type of behavior).
24
Exposure Question
During the school year, about how many times a
week do you usually bring your own lunch to
school from home? 0 1 2 3 4 5
25
Outcome Questions
TOPIC QUESTION
Fruit ?
Vegetables ?
Fast food ?
Soda ?
Fried potatoes ?
High-sugar foods ?
26
Outcome Questions
TOPIC QUESTION
Fruit Yesterday, how many servings of fruit, such as an apple or a banana, did you eat?
Vegetables ?
Fast food ?
Soda ?
Fried potatoes ?
High-sugar foods ?
27
Outcome Questions
TOPIC QUESTION
Fruit Yesterday, how many servings of fruit, such as an apple or a banana, did you eat?
Vegetables Yesterday, how many servings of vegetables, like corn, green beans, green salad or other vegetables did you eat?
Fast food ?
Soda ?
Fried potatoes ?
High-sugar foods ?
28
Outcome Questions
TOPIC QUESTION
Fruit Yesterday, how many servings of fruit, such as an apple or a banana, did you eat?
Vegetables Yesterday, how many servings of vegetables, like corn, green beans, green salad or other vegetables did you eat?
Fast food Yesterday, how many times did you eat fast food?
Soda ?
Fried potatoes ?
High-sugar foods ?
29
Outcome Questions
TOPIC QUESTION
Fruit Yesterday, how many servings of fruit, such as an apple or a banana, did you eat?
Vegetables Yesterday, how many servings of vegetables, like corn, green beans, green salad or other vegetables did you eat?
Fast food Yesterday, how many times did you eat fast food?
Soda Yesterday, how many glasses or cans of soda, such as Coke, or other sweetened drinks, such as fruit punch or Sunny Delight did you drink? Do not count diet drinks.
Fried potatoes ?
High-sugar foods ?
30
Outcome Questions
TOPIC QUESTION
Fruit Yesterday, how many servings of fruit, such as an apple or a banana, did you eat?
Vegetables Yesterday, how many servings of vegetables, like corn, green beans, green salad or other vegetables did you eat?
Fast food Yesterday, how many times did you eat fast food?
Soda Yesterday, how many glasses or cans of soda, such as Coke, or other sweetened drinks, such as fruit punch or Sunny Delight did you drink? Do not count diet drinks.
Fried potatoes Yesterday, how many servings of French fries, home fries, or hash browns did you eat?
High-sugar foods ?
31
Outcome Questions
TOPIC QUESTION
Fruit Yesterday, how many servings of fruit, such as an apple or a banana, did you eat?
Vegetables Yesterday, how many servings of vegetables, like corn, green beans, green salad or other vegetables did you eat?
Fast food Yesterday, how many times did you eat fast food?
Soda Yesterday, how many glasses or cans of soda, such as Coke, or other sweetened drinks, such as fruit punch or Sunny Delight did you drink? Do not count diet drinks.
Fried potatoes Yesterday, how many servings of French fries, home fries, or hash browns did you eat?
High-sugar foods Yesterday, how many servings of high-sugar foods, such as cookies, candy, doughnuts, pastries, cake or popsicles did you eat?
32
Questions for your Cross-Sectional Studies
- One question must obtain information about the
exposure in your hypothesis and the other
question must obtain information about the
outcome in your hypothesis. - The study information on exposure and outcome
must fit into a 2x2 table. - A yes/no question will fit and is recommended.
- If using a multiple choice question, you will
need a predetermined cut point so there is a
higher/lower range to fit into the 2x2 table.
33
The 2x2 table
Optional Use as needed for review of 2x2
tables and necessity for a question about
exposure and a question about outcome
Exposure and Outcome Distributions Among
Individuals in a
Study Population
Yes Outcome
No Outcome
Total
a
b
Yes Exposure
c
d
No Exposure
34
2-3c
Study Variables Questions About
Exposure and Outcome and Additional
Questions
How should we ask about eating a healthy
breakfast?
35
Criteria for a Good Question
- It should be clear and unambiguous, written so
that its intended audience understands it. - It should mean the same thing to everyone who
reads it. - The answer options must categorize and cover the
entire range of possible behavior (from complete
absence of the behavior to a maximum amount of
the behavior). - The time period to consider when answering a
particular question must be appropriate (long or
short enough) to capture the frequency of
behavior desired (depending on the information
desired and the type of behavior).
36
2-3c
Item 5 - Labeling a 2x2 Table
2x2 Table Fill in the two boxes in the table
below, to show how your exposure and outcome
variables will be analyzed in a contingency table
in order to test your hypothesis. (Note if
you plan to use multiple choice questions for
your exposure and/or outcome, determine cut
points for the data so that you can fill in the
contingency table below.)
37
2-3c
Item 6 Additional Questions
Questions to Gather
Additional Information on Participants
Think about what other information about students
in your study would be interesting
to know, in terms of your hypothesis.
(Hint perhaps gender would be one of
these) In the space below, write any additional
questions for your questionnaire that will gather
information about these other characteristics of
your study subjects. .
Should we ask about gender?
38
Break Between Classes
39
2-3d
Sample Questionnaire for
for Cross-Sectional Study
Thank you for your participation in this survey.
Please answer the questions below by circling one
choice for each question. When you are
finished, fold this paper in half and follow
instructions for handing in your
questionnaire. Remember Do not write your name
anywhere on this paper. Study Questions
(Circle one answer for each question) 1.
During the past month, did you usually eat 2 or
more servings of fruits/vegetables per day?
Yes No 2. In the last semester
that you have completed, did you have a grade
average of A or B?
Yes No 3. What is your gender? Male
Female 4. What grade are you in? 6th
grade 7th grade 8th grade
40
Type your questionnaire Make enough copies for
all potential study participants
41
Re-Cap
- Big Ideas in Lesson 2-3
- A good study plan includes
careful thought about
choice of
exposure and outcome variables and high-quality
questions to measure them - Additional questions about other characteristics
of participants can be asked in order to better
understand study results - A well-planned study has a user-friendly
questionnaire to administer to participants
Recommended
CrystalGraphics Presentations


