
EDIT 6900: Research Methods in Instructional Technology - PowerPoint PPT Presentation
Title:
EDIT 6900: Research Methods in Instructional Technology
Description:
EDIT 6900: Research Methods in Instructional Technology Lloyd Rieber Co-Instructor Greg Francom Graduate Assistant TJ Kopcha Co-Instructor UGA, Instructional Technology – PowerPoint PPT presentation
Number of Views:245
Avg rating:3.0/5.0
Title: EDIT 6900: Research Methods in Instructional Technology
1
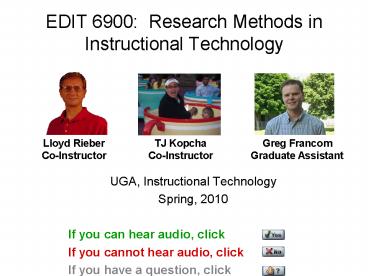
EDIT 6900 Research Methods in Instructional
Technology
Lloyd Rieber Co-Instructor
Greg Francom Graduate Assistant
TJ Kopcha Co-Instructor
- UGA, Instructional Technology
- Spring, 2010
- If you can hear audio, click
- If you cannot hear audio, click
- If you have a question, click
2
To avoid chaos, if you have a question or
comment, click on the Raise Hand, but dont
send/speak your message until prompted by me.
3
Be sure to have the Online Survival Guide by your
side.
4
Preparing for Attending the Weekly Online Class
- BEFORE CLASS
- Do all activities by due date in order to be
prepared for the live class (i.e. read chapters,
view pre-recorded presentations, listen to
podcasts, etc.) - Check email
- Log on to Horizon Wimba Live Classroom
- link is on our courses eLC home page
- Enter Research Methods in Instructional
Technology Room - Have Online Survival Guide by your side
5
Three Topics for Today
- Lessons from the LSAT Logic in Everyday Life
Podcast - Considering the Tools of Research
- Sources of Information
- Measurement as a Tool for Research
- Limiting the data
- Scales of measurement
- Reliability and validity
- Breakout Room Discussion
6
Reminder
- My web hosting company is doing a major upgrade
today, starting at 6 pm and lasting about 12
hours - NowhereRoad.com may be down for up to 4 hours at
some point during this time.
7
Informal ActivitySDCSystematic Data Collection
- An informal, (hopefully) enjoyable activity
designed to give you first-hand experience
collecting research data - Your Task Go and research something of interest
to you! - Report on it informally in writing
- Give 5 minute oral report
- 10, Due April 14
8
Informal ActivitySDC IdeasSystematic Data
Collection
- Personal Finance
- Family
- Health
- Gardening
- Nature
- Pets
- Sport
9
Literature Searching WorkshopFebruary 17, 2010,
500 pmMichael Law, UGA Gwinnett Librarian
10
First Graded Research Design Activity Begins Next
Week!
- Topic Identifying a Researchable Question
11
(No Transcript)
12
Questions?
- Go ahead and enter question in message field, or
- Click and wait for my prompt to
speak.
13
Unchartered Territory
14
Lets choose the person to briefly summarize this
weeks podcast
15
Unchartered TerritoryTake away points
- ETS study showed that 4th graders at 150 (out of
3600) charter schools performed lower than 4th
graders at public schools. - Vindication for public schools, or faulty
datasloppy government stuff? - Is the sample representative?
- When controlled for urban areas, no difference in
test scores - Perhaps high performing public schoolers stay
put? - Comparing only 4th graders is problematic
- Need to track improvement over time
- Problem of generalizing conclusions to ALL public
schools or ALL charter schools in ALL areas
16
Tools of Research
17
Sources of Information
- Beware!
18
But I heard it on Oprah!
19
(No Transcript)
20
(No Transcript)
21
Never use the following as sources of information
in your course project
- Wikipedia, blogs, and most other non-filtered
Internet sources - Articles from newspapers and magazines like Time
and Newsweek - Television and radio broadcasts
- Podcasts
- Get the idea?
22
Measurement as a Tool of Research
- Measurement is limiting the data so that those
data may be interpreted and, ultimately, compared
to an acceptable qualitative or quantitative
standard. - Substantial - having an obvious basis in the
physical world (e.g., an engineer measures the
span of a bridge) - Insubstantial - existing only as concepts, ideas,
opinions, feelings, or other intangible entities
(e.g., the degree to which students have learned) - Data are limited by
- Measurement construct
- Instrument capability
- Amount of raw information we are prepared to
deal with
23
Isolating meaningful data from most research
studies is like _____________ .
24
(No Transcript)
25
(No Transcript)
26
(No Transcript)
27
Husband I lost a shirt button in the
bedroom.Wife Why are you looking for it in the
kitchen?Husband The light is better in
here.
28
Data Sampling
- How Well Do Participants in EDIT 6900 Know
Mathematics?
29
Data SamplingIs giving this problem to solve
sufficient to answer that question?
785 254
30
Interpretation of the Data
31
Four Scales of Measurement
- Nominal Scale
- Ordinal Scale
- Interval Scale
- Ratio Scale
Lets check our understanding
32
When Is It OK to Compute
Nominal Ordinal Interval Ratio
Frequency distributions (i.e. counting finding the mode) Yes Yes Yes Yes
Median and percentiles No Yes Yes Yes
Add or subtract No No Yes Yes
Mean, standard deviation, standard error of the mean No No Yes Yes
Ratio No No No Yes
33
Whats your favorite color?
Color Code
Blue 1
Red 2
Yellow 3
Green 4
Purple 5
34
Whats your favorite color?
Person Color Code
1 Blue 1
2 Blue 1
3 Red 2
4 Yellow 3
5 Blue 1
Average color 1.6
35
Whats your favorite color?
This result makes absolutely no sense because the
data are nominal. Therefore, we cant average
them!
Person Color Code
1 Blue 1
2 Blue 1
3 Red 2
4 Yellow 3
5 Blue 1
Average color 1.6
36
Two Important Types of Statistics
- Measures of Central Tendency
- Measures of variability
37
Measures of Central Tendency
- Mean
- The average of a set of numbers.
- Median
- Given a set of number arranged in descending
order, the median is the number at the midpoint. - Mode
- Given a set of numbers, the mode is the number
with the greatest frequency. - Given a normal distribution, these are all the
same number.
38
The Normal Distribution
39
When they are not the same
Illustration taken from http//engineering.uow.ed
u.au/Courses/Stats/File1514.html
40
Examples of when to use median instead of mean
- Median income
- Imagine a neighborhood of 999 extremely poor
people and 1 billionaire. Is this a rich
neighborhood? - Median price of homes
41
Characteristics of Good Assessment Instruments
- Validity
- Does the instrument assess what it is supposed to
assess - Reliability
- People who know the material do well, those who
dont do poorly consistency - Practicality
- The instrument can be implemented with relative
ease - Efficiency
- The instrument takes as little time as necessary
to get valid and reliable results
42
Understanding Reliability Validity
Are your measurements on target?
43
Understanding Reliability Validity
Reliable, but not valid
44
Understanding Reliability Validity
Not reliable and not valid
45
Understanding Reliability Validity
Reliable and valid
46
Understanding Reliability Validity
Can a test be valid but not reliable?
47
Break-Out Room Discussion
Dr. Kopcha
48
Questions?
- Go ahead and enter question in message field, or
- Click and wait for my prompt to
speak.
49
To do list
- Follow the Course Learning Plan!
Recommended
CrystalGraphics Presentations


