
Figure 11.1 Anatomy of the human eye - PowerPoint PPT Presentation
1 / 59
Title:
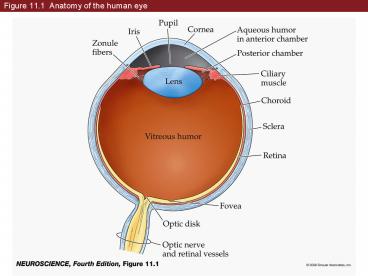
Figure 11.1 Anatomy of the human eye
Description:
Figure 11.1 Anatomy of the human eye Box 11A(1) Myopia and Other Refractive Errors Box 11A(2) Myopia and Other Refractive Errors Figure 11.2 The human eye in the ... – PowerPoint PPT presentation
Number of Views:188
Avg rating:3.0/5.0
Title: Figure 11.1 Anatomy of the human eye
1
Figure 11.1 Anatomy of the human eye
2
Box 11A(1) Myopia and Other Refractive Errors
3
Box 11A(2) Myopia and Other Refractive Errors
4
Figure 11.2 The human eye in the unaccommodated
and accommodated state
5
Figure 11.3 The inner surface of the retina,
viewed with an ophthalmoscope
6
Box 11B The Blind Spot
7
Figure 11.4 Development of the human eye
8
Figure 11.5 Structure of the retina
9
Figure 11.5 Structure of the retina (Part 1)
10
Figure 11.5 Structure of the retina (Part 2)
11
Figure 11.5 Structure of the retina (Part 3)
12
Figure 11.6 Removal of photoreceptor disks by
the pigment epithelium
13
Figure 11.6 Removal of photoreceptor disks by
the pigment epithelium (Part 1)
14
Figure 11.6 Removal of photoreceptor disks by
the pigment epithelium (Part 2)
15
Figure 11.6 Removal of photoreceptor disks by
the pigment epithelium (Part 3)
16
Figure 11.7 Hyperpolarization of cone stimulated
with different amounts of light
17
Box 11D Retinitis Pigmentosa
18
Figure 11.8 Role of outer segment cyclic
GMP-gated channels in photoreceptor light response
19
Figure 11.9 Details of phototransduction in rod
photoreceptors
20
Figure 11.9 Details of phototransduction in rod
photoreceptors (Part 1)
21
Figure 11.9 Details of phototransduction in rod
photoreceptors (Part 2)
22
Figure 11.10 The retinoid cycle and
photoadaptation
23
Figure 11.10 The retinoid cycle and
photoadaptation (Part 1)
24
Figure 11.10 The retinoid cycle and
photoadaptation (Part 2)
25
Figure 11.11 The range of luminance values over
which the visual system operates
26
Figure 11.12 Differential responses of human
rods and cones
27
Figure 11.13 Distribution of photoreceptors in
the human retina
28
Figure 11.13 Distribution of photoreceptors in
the human retina (Part 1)
29
Figure 11.13 Distribution of photoreceptors in
the human retina (Part 2)
30
Figure 11.14 Absorption spectra and distribution
of cone opsins
31
Figure 11.14 Absorption spectra and distribution
of cone opsins (Part 1)
32
Figure 11.14 Absorption spectra and distribution
of cone opsins (Part 2)
33
Box 11E The Importance of Context in Color
Perception
34
Figure 11.15 Effect of cone loss (protanopia and
deuteranopia) on vision
35
Figure 11.15 Effect of cone loss (protanopia and
deuteranopia) on vision (Part 1)
36
Figure 11.15 Effect of cone loss (protanopia and
deuteranopia) on vision (Part 2)
37
Figure 11.15 Effect of cone loss (protanopia and
deuteranopia) on vision (Part 3)
38
Figure 11.16 Genetics of the cone pigments
39
Figure 11.16 Genetics of the cone pigments (Part
1)
40
Figure 11.16 Genetics of the cone pigments (Part
2)
41
Figure 11.16 Genetics of the cone pigments (Part
3)
42
Box 11F(1) The Perception of Light Intensity
43
Box 11F(2) The Perception of Light Intensity
44
Figure 11.17 The responses of on-center and
off-center retinal ganglion cells
45
Figure 11.17 The responses of on-center and
off-center retinal ganglion cells (Part 1)
46
Figure 11.17 The responses of on-center and
off-center retinal ganglion cells (Part 2)
47
Figure 11.17 The responses of on-center and
off-center retinal ganglion cells (Part 3)
48
Figure 11.18 Generation of receptive field
center responses of retinal ganglion cells
49
Figure 11.18 Generation of receptive field
center responses of retinal ganglion cells (Part
1)
50
Figure 11.18 Generation of receptive field
center responses of retinal ganglion cell (Part 2)
51
Figure 11.18 Generation of receptive field
center responses of retinal ganglion cell (Part 3)
52
Figure 11.19 Responses of on-center ganglion
cells to different light conditions
53
Figure 11.19 Responses of on-center ganglion
cells to different light conditions (Part 1)
54
Figure 11.19 Responses of on-center ganglion
cells to different light condition (Part 2)
55
Figure 11.20 Discharge rate of a single
on-center ganglion cell depends on relative light
intensity
56
Figure 11.21 Generation of the receptive field
surround of an on-center retinal ganglion cell
57
Figure 11.21 Generation of the receptive field
surround of an on-center retinal ganglion cell
(Part 1)
58
Figure 11.21 Generation of the receptive field
surround of an on-center retinal ganglion cell
(Part 2)
59
Figure 11.21 Generation of the receptive field
surround of an on-center retinal ganglion cell
(Part 3)
Recommended
CrystalGraphics Presentations


