
;lkjl;jl;jl;k - PowerPoint PPT Presentation
1 / 1
Title:
;lkjl;jl;jl;k
Description:
angular correlation of neutrons emitted from decay of giant dipole resonance in ultra-peripheral collisions at rhic – PowerPoint PPT presentation
Number of Views:12
Avg rating:3.0/5.0
Title: ;lkjl;jl;jl;k
1
ANGULAR CORRELATION OF NEUTRONS EMITTED FROM
DECAY OF GIANT DIPOLE RESONANCE IN
ULTRA-PERIPHERAL COLLISIONS AT RHIC
Kimberly Kirchner (for the STAR Collaboration)
Creighton University
Abstract
ZDC SMD
In an ultra peripheral collision the two nuclei
do not physically overlap. However two virtual
photons are exchanged, which can excite each
nucleus into a giant dipole resonance state,
which decays via neutron emission. The neutrons
are detected in STARs Zero Degree Calorimeters
(ZDC). Each ZDC has a shower maximum detector
(SMD). The two SMDs each consist of vertical and
horizontal slats that give spatial information
about the location of the neutron in the ZDC. The
predicted angular correlation for the emitted
neutrons is C(?F) 1 ½ cos(2?F). Here I
present a preliminary measurement of the
correlation function obtained from the Au-Au
collisions at vsNN 200 GeV in RHIC Run IV.
This work is supported in part by U.S. DoE-EPSCoR
Grant DE-FG02-05ER46186.
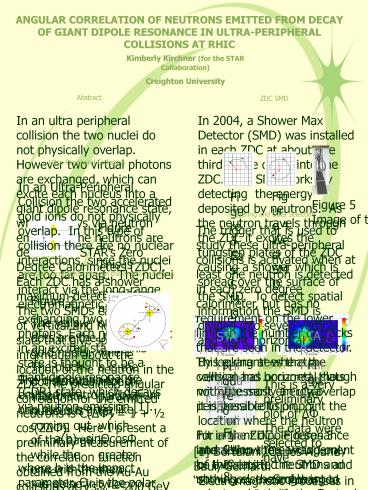
In 2004, a Shower Max Detector (SMD) was
installed in each ZDC at about one third of the
depth into the ZDC. The SMD works by detecting
the energy deposited by neutrons. As the neutron
travels through the ZDC it excites the tungsten
plates of the ZDC causing a shower which is
spread over the surface of the SMD. To detect
spatial information the SMD is divided into seven
vertical and eight horizontal slats. By looking
at where the vertical and horizontal slats with
the most energy overlap it is possible to
pinpoint the location where the neutron hit in
the ZDC. Figures 3 and 4 show the arrangement of
the slats in the SMD and show how the angle is
measured in both the East and West ZDC SMDs from
a known beam center location.
F1
F2
Ultra-Peripheral Collisions
f2
f1
In an Ultra-Peripheral Collision the two
accelerated gold ions do not physically overlap.
In this type of collision there are no nuclear
interactions, since the nuclei are too far apart.
The nuclei interact via the long-range
electromagnetic force, by exchanging two virtual
photons. Each nucleus is left in an excited
state. This state is thought to be a giant dipole
resonance (GDR) state, which decays via neutron
emission 1.
Figure 4 West SMD
Figure 3 East SMD
Figure 5 Image of the SMD
Triggering and Data Selection
Figure 1 This is a representation of an UPC,
where b is the impact parameter, which is greater
then twice the radii of the gold nuclei.
The trigger that is used to study these
ultra-peripheral collisions is activated when at
least one neutron is detected in each zero degree
calorimeter, but has no requirement on the lower
limit on the number of tracks that are seen in
the detector. This guarantees that a collision
has occurred, though not necessarily an
ultra-peripheral collision. For a giant dipole
resonance interaction there would only be two
emitted neutrons and nothing else. So I want to
select events with no charged tracks in the
detector. The figures below show an event after
pedestal and gain correction. The two
dimensional graphs were created by plotting the
product of the horizontal and vertical slats at
intersecting points. Looking at these graphs it
is easier to visualize the location of the
neutron. If we know the location of the beam
center it is then possible to measure the value
of delta phi. The yellow stars show the location
of the beam center for this event. To do this
more precisely I use a Gaussian fit to plots of
the separate vertical and horizontal slats for
both the East and West SMD. Where the mean
positions for the horizontal and vertical
directions intersect gives the location of the
neutron in the SMD. Using that location and a
the known position of the beam center, ?F can be
calculated. The beam center position was
determined for each fill separately. This was
done by finding the mean neutron position for
each event, and then averaging over all the
events 3.
Angular Correlation between the emitted neutrons
Figure 2 The yellow dots are the gold nuclei.
The black dot denotes that that nucleus is coming
out of the page while the one with the x is going
in to the page. b is the impact parameter it
lies along the dashed line. The red dots are the
emitted neutrons. The angles F1 and F2 are the
angles at which the neutrons are emitted with
respect to the impact parameter. The angles f1
and f2 are measured to STARs x axis and are what
is experimentally obtained. The two sets of
angles differ by a rotation from the impact
parameter. ?F is the same in either coordinate
system.
STAR
F1
f1
b
F2
f2
STAR Preliminary
STAR Preliminary
Nuclei
Figure 7
Figure 6
?F Plot
The distribution for the emitted neutron a(b)
from one nucleus goes like, a(b)sinTcosF where
b is the impact parameter, T is the polar angle
and F is the azimuthal angle 2. These angles
are measured with respect to the impact parameter
b. Figure 2 shows the coordinates of this
system. The polar angle points from the z axis
in towards the page. For two nuclei the
distribution of the emitted neutrons is the
product of the individual distributions, a12(b)
a1(b)a2(b) sinT1cosF1sinT2cosF2 where the
subscripts 1 and 2 represent the two interacting
nuclei. Since both nuclei have the same impact
parameter there should be an angular correlation
between the two ejected neutrons 2. However
since the impact parameter cannot be measured and
will be different for each collision the
difference of the two angles, ?F f 1 f2
becomes an important quantity since it can be
measured. In this case the polar angle is
approximately 90 so the sinT terms go to 1. The
predicted angular correlation is C(?F) 1 ½
cos(2?F) The most probable angular correlations
are expected when ?F is equal to 0 or p.
- This is a very preliminary plot of ?F. The data
were selected to have - zero charged tracks
- total reading in the SMD greater then zero
- least a peak in the horizontal and vertical
directions - only one neutron in each ZDC
- The plot was made with less than 1 of the
triggered data. It may be improved with better
statistics and refining the methods of selecting
and analyzing the events.
STAR Preliminary
Figure 8
References
1 Bertulani, Carlos A. and Baur, Gerhard.
Electromagnetic Processes in Relativistic Heavy
Ion Collisions. Physics Reports (Review Section
of Physics Letters) 163 (1988) 299-408. 2
Baur, Gerhard., et al. Multiphoton Exchange
Processes in Ultraperipheral Relativistic Heavy
Ion Collisions. Nuclear Physics A729 (2003)
787-808. 3 Wang, Gang. Correlations Relative
to the Reaction Plane at the Relativistic Heavy
Ion Collider Based on Transverse Deflection of
Spectator Neutrons. Doctoral Dissertation.
Kent State University, April 2006.
Recommended
CrystalGraphics Presentations


