
Supplementary Fig. 1 Chiga et al. - PowerPoint PPT Presentation
1 / 4
Title:
Supplementary Fig. 1 Chiga et al.
Description:
Numbers above the pictures of representative immunoblots indicate the relative abundance of phosphorylated NCC (means+s.e.m, n=5). – PowerPoint PPT presentation
Number of Views:19
Avg rating:3.0/5.0
Title: Supplementary Fig. 1 Chiga et al.
1
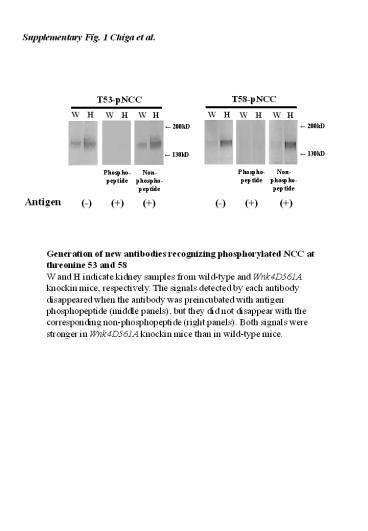
Supplementary Fig. 1 Chiga et al.
Generation of new antibodies recognizing
phosphorylated NCC at threonine 53 and 58 W and
H indicate kidney samples from wild-type and
Wnk4D561A knockin mice, respectively. The signals
detected by each antibody disappeared when the
antibody was preincubated with antigen
phosphopeptide (middle panels), but they did not
disappear with the corresponding
non-phosphopeptide (right panels). Both signals
were stronger in Wnk4D561A knockin mice than in
wild-type mice.
2
Supplementary Fig. 2 Chiga et al.
Confirmation of the phospho-specificity of the
antibodies by phosphatase treatment Kidney
samples from Wnk4D561A knockin mice were treated
with Lambda protein phosphatase (New England
Biolabs) for 30 min at 30oC and then resolved by
SDS-PAGE along with a sample without phosphatase
treatment. Phosphatase treatment abolished the
bands detected by the anti-pOSR1/SPAK and
anti-pNCC antibodies, but the treatment did not
affect the bands detected by anti-total OSR1/SPAk
and anti-total NCC antibodies.
3
Supplementary Fig. 3 Chiga et al.
p-OSR1 /SPAK
p-OSR1 /SPAK
parvalbumin
calbindinD28K
merge
merge
Immunofluorescence of p-OSR1/SPAK in wild-type
mice p-OSR1/SPAK (green) is co-localized with
parvalbumin (red in upper left panels) and
calbindin D28K (red in upper right panels). Red
signals in the lower panels are the combination
of calbindin and parvalbumin. Most of the
pOSR1/SPAK signals (green) are localized in the
segments positive for parvalbumin (DCT1) plus
calbindin (DCT2), suggesting that p-OSR1/SPAK is
mostly co-localized with NCC.
4
Supplementary Fig. 4 Chiga et al.
Figure 4 Phosphorylation of NCC at T53 and T58
was also aldosterone sensitive Samples were the
same as those in Fig. 6. Numbers above the
pictures of representative immunoblots indicate
the relative abundance of phosphorylated NCC
(meanss.e.m, n5). The signals of p-NCC divided
by the signals of total NCC were compared by
ANOVA. In mice fed a high-NaCl diet, aldosterone
significantly (plt0.05) increased the
phosphorylation of NCC. In mice fed a low-NaCl
diet, spironolactone significantly (plt0.05)
decreased the phosphorylation of NCC.
Recommended
CrystalGraphics Presentations


![CUBICULUM OF LEONIS, CATACOMB OF COMMODILLA Near Rome. Late 4th century. [Fig. 07-01] PowerPoint PPT Presentation](https://s3.amazonaws.com/images.powershow.com/7385139.th0.jpg?_=201511170211)


![[PDF READ ONLINE] Oh! Top 50 Fig Recipes Volume 3: The Best-ever of Fig Cookbook PowerPoint PPT Presentation](https://s3.amazonaws.com/images.powershow.com/10072969.th0.jpg?_=20240705128)
