
Instructions for using this template. - PowerPoint PPT Presentation
Title:
Instructions for using this template.
Description:
Title: No Slide Title Author: Valued Customer Last modified by: Thadd Created Date: 3/8/1999 4:42:31 PM Document presentation format: On-screen Show (4:3) – PowerPoint PPT presentation
Number of Views:377
Avg rating:3.0/5.0
Title: Instructions for using this template.
1
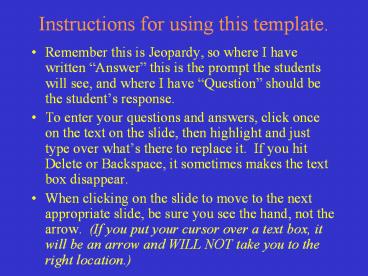
Instructions for using this template.
- Remember this is Jeopardy, so where I have
written Answer this is the prompt the students
will see, and where I have Question should be
the students response. - To enter your questions and answers, click once
on the text on the slide, then highlight and just
type over whats there to replace it. If you hit
Delete or Backspace, it sometimes makes the text
box disappear. - When clicking on the slide to move to the next
appropriate slide, be sure you see the hand, not
the arrow. (If you put your cursor over a text
box, it will be an arrow and WILL NOT take you to
the right location.)
2
Jeopardy
Choose a category. You will be given the
answer. You must give the correct question.
Click to begin.
3
Choose a point value.
Choose a point value.
Click here for Final Jeopardy
4
Theoretical Probability
Graphs
Misleading graphs
Vocabulary
Experimental Probability
10 Point
10 Point
10 Point
10 Point
10 Point
20 Points
20 Points
20 Points
20 Points
20 Points
30 Points
30 Points
30 Points
30 Points
30 Points
40 Points
40 Points
40 Points
40 Points
40 Points
50 Points
50 Points
50 Points
50 Points
50 Points
5
The Outcome that you want to occur
6
Favorable Outcome
7
All the available outcomes
8
Possible Outcomes
9
Finding the chances of a result
10
Probability
11
A table to show the amount of times an outcome
occurred
12
Frequency table Or Cumulative Frequency Table
13
The number of ways an outcome can fail to happen
the number of ways an outcome can happen
14
Odds Against
15
Using a number cube P(gt4)
16
33.3
17
Using a standard deck of cards P(Ace)
18
7.7
19
A bag of marbles with 4 red, 5 green, 7 blue, 6
yellow P(red and yellow) Without replacing
20
5.2
21
A manufacturer finds that there are 3 defects in
each 126 bulbs checked. In a shipment of 1265
bulbs, how many can be expected to be defected?
22
30.12 bulbs will be defected
23
What is the probability of a family having 3 sons
in a row?
24
12.5
25
Using the above table, What is the probability
of rolling a 2
Outcomes 1 2 3 4 5 6
Frequency 4 5 7 4 2 6
26
17.9
27
Outcomes 1 2 3 4 5 6
Frequency 2 8 8 9 11 6
P(4)
28
20.5
29
Color of Shirts Frequency
Red 10
Yellow 8
Green 7
Blue 14
P(red)
30
25.6
31
Color of Shirts Frequency
Red 10
Yellow 8
Green 7
Blue 14
P(green)
32
17.9
33
You have the probability of 1/7 of picking a
purple marble. There are 182 marbles in the bag.
How many are purple?
34
26 purple marbles
35
Make a stem and leaf plot Gallons of gas used 21,
14, 25, 36, 21, 52, 21, 14, 32, 19, 18, 35
36
Gallons of gas used
Stem0 Leaf
1 4 4 8 9
2 1 1 1 5
3 2 5 6
4
5 2
37
Gallons of gas used
Find the mean, median, mode and range of the stem
and leaf plot
Stem0 Leaf
1 4 4 8 9
2 1 1 1 5
3 2 5 6
4
5 2
38
Mean 25.67
Median 21
Mode 21
range 38
39
Make a histogram for the following data Yards of
yarn purchased 1, 1, 4, 5, 6, 8, 8, 8, 9, 9, 10,
11, 12, 13, 13, 16, 16 , 20 describe the
distribution
40
Intervals 5 Distribution normal Titles and
labels
41
Answer 4d
42
Question 4d
43
Make a circle graph Movies Comedies 4 Romance
6 Drama 5 Science Fiction 7
44
Movie Type fraction Percent degree
Comedy 4/22 18.2 65.45
Romance 6/22 27.3 98.18
Drama 5/22 22.8 81.81
Science Fiction 7/22 31.8 114.54
45
Is this a misleading graph?
46
Yes because it is 3-D
47
Is this a misleading graph?
Price of Stocks
thousands
Dollars
Year
48
No it has titles, good intervals, and line graphs
deal with change over time
49
What graph shows the attendance of the West
Virginia home games?
50
Bar graph
51
What graph shows the attendance of West Virginia
and Michigan football home games
52
Double Bar Graph
53
Give at least 4 ways to create a misleading graph
54
- Break on the y-axis
- Intervals are not equal
- Icons are not equal
- Icons are different colors
55
Final Jeopardy
Make your wager
56
Explain the difference between dependent and
independent event and make an example of each
57
Teacher must check!