
Mark recapture lectures - PowerPoint PPT Presentation
Title:
Mark recapture lectures
Description:
Title: Mark recapture lectures Author: diane srivastava Last modified by: diane srivastava Created Date: 1/14/2003 4:43:34 AM Document presentation format – PowerPoint PPT presentation
Number of Views:123
Avg rating:3.0/5.0
Title: Mark recapture lectures
1
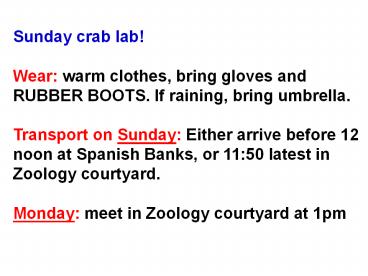
Sunday crab lab! Wear warm clothes, bring
gloves and RUBBER BOOTS. If raining, bring
umbrella. Transport on Sunday Either arrive
before 12 noon at Spanish Banks, or 1150 latest
in Zoology courtyard. Monday meet in Zoology
courtyard at 1pm
2
Snow Goose
La Pérouse Bay
3
Herding flightless geese into a keyhole net
4
Recording which birds are marked, and marking new
birds
5
Goose biologist
Goose leg bands
6
LPB Colony size
Year
7
Mark recapture lectures
- Petersen method
- Schnabel method
- Schumacher-Eschmeyer
- Jolly Seber
Closed population
Open population
Overview of methods to help your reading of Krebs
Chp 2
8
Closed populations
- No individuals enter or leave the population
between surveys
Survey 2
Survey 1
9
Open populations
- Individuals enter or leave the population between
surveys
Survey 2
Survey 1
10
What makes a population closed?
- Dispersal barriers
- Philopatry
- Large surveyed area
- Slow reproductive/death rate
- Short time between surveys
11
What type of population are the snow geese?
12
Petersen method Closed population
Survey 1
Survey 2
Catch several animals
Catch C animals
Count recaptures (R)
Mark all M animals
Return animals to population
Return animals to population
13
(No Transcript)
14
What is the total population size (N)?
Note that the proportion marked in the
population equals the proportion marked in the
2nd sample
M 12
C 15 R 4
15
What is the total population size (N)?
Note that the proportion marked in the
population equals the proportion marked in the
2nd sample
N (M1) (C1) (R1)
-1
M 12
C 15 R 4
16
When would Petersen give you a bad estimate?
- Population not closed
- Marked animals likely to be re-trapped
- Marked animals likely to die
- Marks fall off
17
Schnabel method closed population
Survey 1
Essentially, Petersen estimates on multiple
surveys
18
Schnabel method closed population
19
Schnabel method closed population
Survey t
Catch Ct animals
Whats the relationship between Ct, Rt, and Ut ?
Record Rt recaptures
Mark Ut unmarked animals
Ct Rt Ut
Return animals to population
20
Schnabel method example
Time (t) Ct Rt Ut
1 20
2 20 5
3 20 13
4 20 10
How many individuals marked by beginning of time
5?
21
Schnabel method example
Time (t) Ct Rt Ut
1 20 0 20
2 20 5 15
3 20 7 13
4 20 10 10
How many individuals marked by beginning of time
5?
22
Schnabel method example
Time (t) Ct Rt Ut
1 20 0 20
2 20 5 15
3 20 7 13
4 20 10 10
S 58
23
Schnabel method example
Time (t) Ct Rt Ut
1 20 0 20
2 20 5 15
3 20 7 13
4 20 10 10
In general Mt U1 U2..Ut-1
S 58
24
Schnabel formulas
- N S (Ct Mt)
- S Rt
Marked gt 10 of population
N S (Ct Mt) S Rt1
Marked lt 10 of population
( just weighted average of Petersen estimates!)
25
Schnabel method example
Time (t) Ct Rt Ut Mt CtMt
1 20 0 20
2 20 5 15 20
3 20 7 13 35
4 20 10 10
0
48
26
Schnabel method example
Time (t) Ct Rt Ut Mt CtMt
1 20 0 20 0
2 20 5 15 20 400
3 20 7 13 35 700
4 20 10 10 960
0
48
S 2060
S 22
27
Schnabel method example
Time (t) Ct Rt Ut Mt CtMt
1 20 0 20 0
2 20 5 15 20 400
3 20 7 13 35 700
4 20 10 10 960
0
- N S (Ct Mt) 2060 94
- S Rt 22
48
S 2060
S 22
28
Schnabel method example
Time (t) Ct Rt Ut Mt CtMt
1 20 0 20 0
2 20 5 15 20 400
3 20 7 13 35 700
4 20 10 10 960
0
- What proportion of total population marked by end?
48
S 2060
S 22
29
Scumacher-Eschmeyer method (for Schnabel
experiment)
- N C M
- R
y mx b
30
Scumacher-Eschmeyer method (for Schnabel
experiment)
- N C M
- R
R C
Slope ?
M
Recommended
CrystalGraphics Presentations


