
Table 1. Comparison between the provisional diagnosis - PowerPoint PPT Presentation
Title:
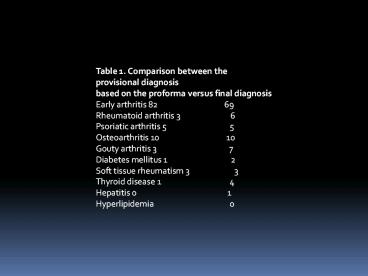
Table 1. Comparison between the provisional diagnosis
Description:
Table 1. Comparison between the provisional diagnosis. based on the . proforma. versus final diagnosis. Early arthritis 82 69 – PowerPoint PPT presentation
Number of Views:28
Avg rating:3.0/5.0
Title: Table 1. Comparison between the provisional diagnosis
1
Table 1. Comparison between the provisional
diagnosis based on the proforma versus final
diagnosis Early arthritis 82
69 Rheumatoid arthritis 3
6 Psoriatic arthritis 5
5 Osteoarthritis 10
10 Gouty arthritis 3
7 Diabetes
mellitus 1
2 Soft tissue rheumatism 3
3 Thyroid disease 1
4 Hepatitis 0
1 Hyperlipidemia
0
2
Table 2. Demographic data of all patients
included in this study Number of patients
assessed in the early arthritis clinic 108 Number
of patients diagnosed as early arthritis
69 Femalemale ratio 609 Mean age (years)
50.03 Disease duration (symptom-assessment)
(mean) 6.1 months Referral lag time
(GP-assessment) (mean) 3.4 weeks Number of
patients on non-steroidal anti-inflammatory drugs
65/69 Number of patients on steroid therapy 4/69
3
Table 3. Clinical characteristics of the patients
suffering from early arthritis assessed. Patients
presenting with hand joint pain 67/69
(97.1) Patients presenting with joint pain gt3
joints 64/69 (92.8) Symmetric arthritis 34/69
(49.3) Positive compression test MCP joints
47/69 (68.1) Positive compression test MTP
joints 31/69 (44.9) Duration of morning
stiffness (mean) 44.35minutes Subcutaneous
nodules 0/69 Baseline HAQ 0.831 Hand erosions
by X-ray 0/69 Rheumatoid factor positive 25/69
(36.23) ESR (mean) 23 mm/hour CRP (mean)
8.56mg/litre ESR Erythrocyte sedimentation
rate CRP C-reactive protein HAQ Health
assessment questionnaire MCP
Metacarpophalangeal MTP Metatarsophalangeal
4
Table 4. Correlation between the disease
activity parameters in the patients with early
arthritis MS CRP ESR
PhGH PS PGH SJC TJC
0.831 0.303 0.305 0.709
0.623 0.622 0.358 SJC 0.132
0.156 0.278 0.360 0.421
0.415 PGH 0.562 0.075 0.084
0.761 0.975 PS 0.421
-0.082 0.066 0.734 PhGH
0.560 0.245 0.280 ESR 0.141
0.332 CRP 0.133 plt0.001 plt0.05 MS
Morning stiffness CRP C-reactive
protein ESR Erythrocyte sedimentation rate
PGH Patient global health assessment PhGH
Physician global health assessment PS Pain
score SJC Swollen joint count TJC Tender
joint count
5
The early arthritis clinic model helps to shorten
the referral lag time as well as lag time to
start disease-modifying antirheumatic drug
therapy.
Recommended
CrystalGraphics Presentations


