
World Population Growth Through History - PowerPoint PPT Presentation
1 / 18
Title:
World Population Growth Through History
Description:
Title: No Slide Title Author: Theresa Kilcourse Last modified by: L500-018 Created Date: 2/17/2003 3:05:44 PM Document presentation format: On-screen Show (4:3) – PowerPoint PPT presentation
Number of Views:18
Avg rating:3.0/5.0
Title: World Population Growth Through History
1
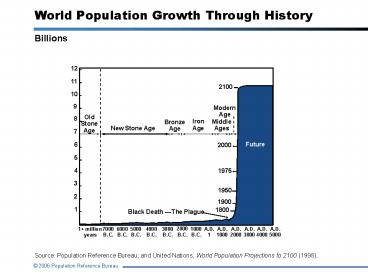
World Population Growth Through History
Billions
12
11
2100
10
9
Modern
Age
Old
8
Iron
Middle
Bronze
Stone
Age
New Stone Age
Age
Ages
Age
7
Future
6
2000
5
4
1975
3
1950
2
1900
1
1800
Black Death
The Plague
A.D.
A.D.
A.D.
1000
2000
3000
4000
5000
6000
7000
1 million
A.D.
A.D.
A.D.
B.C.
B.C.
B.C.
years
2000
1000
1
B.C.
B.C.
B.C.
B.C.
3000
4000
5000
Source Population Reference Bureau and United
Nations, World Population Projections to 2100
(1998).
2
World Population Growth, in Billions
Number of years to add each billion (year)
All of Human History
(1800)
130 (1930)
30 (1960)
15 (1975)
12 (1987)
12 (1999)
14 (2013)
14 (2027)
21 (2048)
Sources First and second billion Population
Reference Bureau. Third through ninth billion
United Nations, World Population Prospects The
2004 Revision (medium scenario), 2005.
3
Growth in More, Less Developed Countries
Billions
Less Developed Regions
More Developed Regions
Source United Nations, World Population
Prospects The 2004 Revision (medium scenario),
2005.
4
World Population Clock
2005
Natural Increase per World More Developed Countries Less Developed Countries Less Developed Countries (less China)
Year 80,794,218 1,234,907 79,559,311 71,906,587
Day 221,354 3,383 217,971 197,004
Minute 154 2 151 137
Source Population Reference Bureau, 2005 World
Population Data Sheet.
5
Projected Population Change, by Country
Percent Population Change, 2005-2050
Source Population Reference Bureau, 2005 World
Population Data Sheet.
6
The Classic Stages of Demographic Transition
Note Natural increase is produced from the
excess of births over deaths.
7
Birth and Death Rates, Worldwide
Rates of birth, death, and natural increase per
1,000 population
Natural Increase
Source United Nations, World Population
Prospects The 2004 Revision, 2005.
8
10 Places With the Lowest Total Fertility
Worldwide
Average number of children per woman, 2000-2005
Source United Nations, World Population
Prospects The 2004 Revision, 2005.
9
Women of Childbearing Age
Number of Women 15 to 49 Billions
Source United Nations, World Population
Prospects The 2004 Revision (medium scenario),
2005.
10
Diverging Trends in Fertility Reduction
Average number of children per woman
Source United Nations, World Population
Prospects The 2004 Revision, 2005.
11
Trends in Life Expectancy, by Region
Life Expectancy at Birth, in Years
Source United Nations, World Population
Prospects The 2004 Revision (medium scenario),
2005.
12
Trends in Urbanization, by Region
Urban Population Percent
Source United Nations, World Urbanization
Prospects The 2003 Revision (medium scenario),
2004.
13
Largest Cities, Worldwide
Millions
1950
2000 2015
Source United Nations, World Urbanization
Prospects The 2003 Revision (medium scenario),
2004.
14
Urbanization in Central America
Population Living in Urban Areas Percent
Source United Nations, World Urbanization
Prospects The 2003 Revision (medium scenario),
2004.
15
Age Distribution of the Worlds Population
Population Structures by Age and Sex, 2005
Millions
Less Developed Regions
More Developed Regions
Age
80 75-79 70-74 65-69 60-64 55-59 50-54 45-49
40-44 35-39 30-34 25-29 20-24 15-19 10-14 5-9 0-4
Male
Female
Male
Female
Source United Nations, World Population
Prospects The 2004 Revision, 2005.
16
Trends in Aging, by World Region
Population Ages 65 and Older Percent
Source United Nations, World Population
Prospects The 2004 Revision (medium scenario),
2005.
17
Women and Aging
Projected World Population, by Sex, at Specified
Age Groups, 2025 Percent
Source United Nations, World Population
ProspectsThe 2004 Revision (medium scenario),
2005.
18
Adult Literacy, by Region
Literacy Rates, by Sex, 2000-2004 Percent
Source UNESCO Institute for Statistics accessed
online at www.uis.unesco.org/TEMPLATE/html/Excelta
bles/education/Literacy_Regional_April2006.xls on
May 21, 2006.