
Graphing Linear Equations - PowerPoint PPT Presentation
Title:
Graphing Linear Equations
Description:
Graphing Linear Equations In Standard Form Ax + By = C Graphing Linear Equations In Standard Form Ax + By = C Linear equations have two variables and when we plot all ... – PowerPoint PPT presentation
Number of Views:777
Avg rating:3.0/5.0
Title: Graphing Linear Equations
1
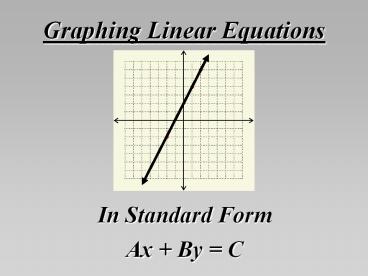
Graphing Linear Equations
- In Standard Form
- Ax By C
2
Linear equations have two variables and when we
plot all the (x,y) pairs that make the equation
true we get a line.
We will use The Standard Form of the equation
to graph the line.
3
The formula for Standard Form is
Ax By C
We can find 3 things just by looking at the
formula
To find where the line crosses each axis, let
the other value be zero.
- If y is zero, we have Ax C
- is the x-intercept.
- If x is zero, we have By C
- is the y-intercept.
- - is the slope.
A B
Using the x-intercept and/or y-intercept as a
starting point, you can use the slope to graph
more points on the line of the equation.
4
These equations are all in Standard Form
2x y -1 x y -4 3x 2y 4
Notice that these equations are all in the form
Ax By C.
5
2x y -1
- Find the x-intercept
- -1 2 -1/2
- 2) Find the y-intercept
- -1 -1 1
- 3) Plot the y-intercept.
4) Find the slope -A/B
- 2/-1 2 5) Plot more points using the slope.
6
x y -4
- Find the x-intercept
- -4 1 -4
- 2) Find the y-intercept
- -4 1 -4
- 3) Plot the x and y-intercepts.
4) Find the slope -a/b
- 1/1 -1 5) Plot more points using the slope.
7
A graph with only one letter (x or y) only
crosses that axis at that point.
y 5 ONLY crosses the y-axis at 5
x -3 ONLY crosses the x-axis at -3
8
SUMMARY The formula for Standard Form is
Ax By C
- If y0, C A gives the
- x-intercept
- If x0, C B gives the
- y-intercept
- - is the
- slope
A B
Using the x-intercept and/or y-intercept as a
starting point, you can use the slope to graph
the line of the equation.
Recommended
CrystalGraphics Presentations


