
Optical Loss Budget (Example 2) - PowerPoint PPT Presentation
1 / 37
Title:
Optical Loss Budget (Example 2)
Description:
Optical Loss Budget (Example 2) 1000BASE-ZX GBIC Ptmax = 5 dBm Ptmin = 0 dBm Prmax = -3 dBm Prmin = -23 dBm Questions: Can you connect one GBIC to another with only a ... – PowerPoint PPT presentation
Number of Views:737
Avg rating:3.0/5.0
Title: Optical Loss Budget (Example 2)
1
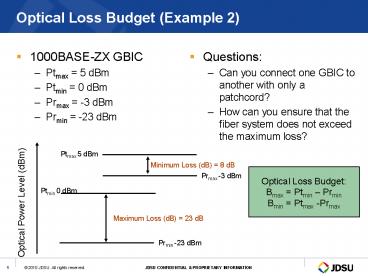
Optical Loss Budget (Example 2)
- 1000BASE-ZX GBIC
- Ptmax 5 dBm
- Ptmin 0 dBm
- Prmax -3 dBm
- Prmin -23 dBm
- Questions
- Can you connect one GBIC to another with only a
patchcord? - How can you ensure that the fiber system does not
exceed the maximum loss?
Ptmax 5 dBm
Minimum Loss (dB) 8 dB
Optical Loss Budget Bmax Ptmin Prmin Bmin
Ptmax -Prmax
Prmax -3 dBm
Ptmin 0 dBm
Optical Power Level (dBm)
Maximum Loss (dB) 23 dB
Prmin -23 dBm
2
Test!
- Basic Tests
- Visual Fault Locator (VFL)
- Optical Insertion Loss
- Optical Power Levels
- Advanced Tests
- Optical Return Loss (ORL)
- Optical Time Domain Reflectometer (OTDR)
- Chromatic Dispersion (CD)
- Polarization Mode Dispersion (PMD)
- Optical Spectral Analysis (OSA)
3
Visual Fault Locator
- VFLs provide a visible red light source useful
for identifying fiber locations, detecting faults
due to bending or poor connectorization, and to
confirming continuity. - VFL sources can be modulated in a number of
formats to help identify the correct VFL (where a
number of VFL tests may be performed).
FFL-100
FFL-050
4
Advanced Tests
- Optical Return Loss (ORL)
- Optical Time Domain Reflectometer (OTDR)
- Detect, locate, and measure events at any
location on the fiber link - Fiber Characterization
- Determines the services that the fiber can be
carry - Basic tests plus
- Chromatic Dispersion (CD)
- Polarization Mode Dispersion (PMD)
- Optical Spectrum Analysis (OSA)
- Spectral analysis for Wavelength Division
Multiplexing (WDM) systems
5
Introduction to OTDR
Its the single most important tester used in the
installation, maintenance troubleshooting of
fiber plant
- Most versatile of Fiber Test Tools
- Detect, locate and measure events at any
location on the fiber link - Identifies events impairments (splices, bends,
connectors, breaks) - Provides physical distance to each event/
impairment - Measures fiber attenuation loss of each event
or impairment - Provides reflectance / return loss values for
each reflective event or impairment - Manages the data collected and supports data
reporting.
T-BERD 4000 FTTx / Access OTDR
6
Background on Fiber Phenomena
- OTDR depends on two types of phenomena
- Rayleigh scattering
- Fresnel reflections.
Light reflection phenomenon Fresnel reflection
Rayleigh scattering and backscattering effect in
a fiber
7
How does it work ?
- The OTDR injects a short pulse of light into one
end of the fiber and analyzes the backscatter and
reflected signal coming back - The received signal is then plotted into a
backscatter X/Y display in dB vs. distance - Event analysis is then performed in order to
populate the table of results.
OTDR Block Diagram
Example of an OTDR trace
8
Type of Fiber and Wavelengths
- Single Mode (SM)
- 1310 1550nm are primary wavelengths used in SM
OTDR measurements - 1625nm is used in trouble-shooting when testing
on active networks is needed - Multimode (MM)
- 850 1300nm are dominant wavelengths used in MM
transmission testing
9
Dynamic Range Injection Level
- Dynamic Range determines the observable length
of the fiber depends on the OTDR design and
settings - Injection level is the power level in which the
OTDR injects light into the fiber under test - Poor launch conditions, resulting in low
injection levels, are the primary reason for
reductions in dynamic range, and therefore
accuracy of the measurements - Effect of pulse width the bigger the pulse, the
more backscatter we receive
10
What does an OTDR Measure ?
- Distance
- The OTDR measurement is based on Time The
round trip time travel of each pulse sent down
the fiber is measured. Knowing the speed of light
in a vacuum and the index of refraction of the
fiber glass, distance can then be calculated.
Fiber distance Speed of light (vacuum) X time
2 x IOR
11
What does an OTDR Measure ?
- Attenuation (also called fiber loss)Expressed
in dB or dB/km, this represents the loss, or rate
of loss between two events along a fiber span
12
What does an OTDR Measure ?
- Event LossDifference in optical power level
before and after an event, expressed in dB
Connector orMechanical Splice
Fusion Splice or Macrobend
13
What does an OTDR Measure ?
- ReflectanceRatio of reflected power to incident
power of an event, expressed as a negative dB
value - The higher the reflectance, the more light
reflected back, the worse the connection - A -50dB reflectance is better than -20dB value
- Typical reflectance values
- Polished Connector -45dB
- Ultra-Polished Connector -55dB
- Angled Polished Connector -65dB
14
What does an OTDR Measure ?
- Optical Return Loss (ORL)Measure of the amount
of light that is reflected back from a feature
forward power to the reflected power. The bigger
the number in dBs the less light is being
reflected. - The OTDR is able to measure not only the total
ORL of the link but also section ORL
Attenuation (dB)
ORL of the defined section
Distance (km)
15
Optical Return Loss (ORL)
- Light reflected back to the source
PT Output power of the light source PAPC
Back-reflected power of APC connector PPC
Back-reflected power of PC connector PF
Backscattered power of fiber PB Total amount of
back-reflected power
16
Effects of High ORL Values
- All laser sources, especially distributed
feedback lasers, are sensitive to optical
reflection, which causes spectral fluctuation
and, subsequently, power jitter. Return loss is a
measure of the amount of reflection accruing in
an optical system. A -45dB reflection is
equivalent to 45dB return loss (ORL). A minimum
of 45-50dB return loss is the industry standard
for passive components to ensure normal system
operation in singlemode fiber systems. - Increase in transmitter noise
- Reducing the OSNR in analog video transmission
- Increasing the BER in digital transmission
systems - Increase in light source interference
- Changes central wavelength and output power
- Higher incidence of transmitter damage
SC - PC
SC - APC
- The angle reduces the back-reflection of the
connection.
17
OTDR Events
- How to interpret a trace
18
How to interpret an OTDR Trace
19
Front End Reflection
Connection between the OTDR and the patchcord or
launch cable Located at the extreme left edge of
the trace
Reflectance Polished Connector -45dB
Ultra-Polished Connector -55dB Angled
Polished Connector up to -65dB Insertion
Loss Unable to measure
20
Dead Zones
- Attenuation Dead Zone (ADZ) is the minimum
distance after a reflective event that a
non-reflective event can be measured (0.5dB) - In this case the two events are more closely
spaced than the ADZ, and shown as one event - ADZ can be reduced using shorter pulse widths
- Event Dead Zone (EDZ) is the minimum distance
where 2 consecutive unsaturated reflective events
can be distinguished - In this case the two events are more closely
spaced than the EDZ, and shown as one event - EDZ can be reduced using shorter pulse widths
21
Connector
A connector mechanically mates 2 fibers together
and creates a reflective event
- Reflectance
- Polished Connector -45dB
- Ultra-Polished Connector -55dB
- Angled Polished Connector up to
-65dBInsertion Loss 0.5dB - (loss of 0.2dB w/ very good connector)
22
Fusion Splices
A Fusion Splice thermally fuses two fibers
together using a splicing machine
Reflectance None Insertion Loss lt 0.1dB
A Gainer is a splice gain that appears when two
fibers of different backscatter coefficients are
spliced together (the higher coefficient being
downstream)
Reflectance None Insertion Loss Small gain
23
Fusion Splices
Direction A-B Direction B-A
24
Macrobend
- Macrobending results from physical bending of
the fiber. - Bending Losses are higher as wavelength
increases. - Therefore to distinguish a bend from a splice,
two wavelengths are used (typically 1310 1550nm)
Reflectance None Insertion Loss Varies w/
degree of bend wavelength
25
Mechanical Splice
A Mechanical Splice mechanically aligns two
fibers together using a self-contained assembly.
Reflectance -35dB Insertion Loss 0.5dB
26
Fiber End or Break
A Fiber End or Break occurs when the fiber
terminates. The end reflection depends on the
fiber end cleavage and its environment.
Reflectance PC open to air -14dB
APC open to air - 35dB Insertion Loss High
(generally)
27
Ghosts
A Ghost is an unexpected event resulting from a
strong reflection causing echos on the
trace When it appears it often occurs after the
fiber end. It is always an exact duplicate
distance from the incident reflection.
Reflectance Lower than echo source Insertion
Loss None
28
Typical Attenuation Values
- 0.2 dB/km for singlemode fiber at 1550 nm
- 0.35 dB/km for singlemode fiber at 1310 nm
- 1 dB/km for multimode fiber at 1300 nm
- 3 dB/km for multimode fiber at 850 nm
- 0.05 dB for a fusion splice
- 0.3 dB for a mechanical splice
- 0.5 dB for a connector pair (FOTP-34)
- Splitters/monitor points (varys with component)
29
Best Practices with OTDRs
30
Performing an OTDR Test
- Inspect Clean connector end faces (patch cords
bulkheads (including test instrument) - Set up instrument for test environment
- Test
- View trace/table of results
- Store / Report Results
- Further analysis optional (for advanced users)
31
Key OTDR Setup Parameters for Manual Operation
- Pulse Width
- Controls the amount of light injected into the
fiber - A short pulse width enables high resolution and
short dead zones, but limited dynamic range - A long pulse width enables high dynamic range
but less resolution and longer dead zones
5ns
1µs
- Short Pulse
- More Resolution
- Shorter Dead Zones
- Less Dynamic Range
- More Noise
- Long Pulse
- Less Resolution
- Wider Dead Zones
- More Dynamic Range
- Less Noise
100ns
32
Key OTDR Setup Parameters for Manual Operation
- Acquisition Time (Averaging)
- Length of time the OTDR takes to acquire and
average the data points - Increasing acquisition time improves the dynamic
range w/o affecting the resolution or dead zones.
5s
30s
20s
33
Key OTDR Setup Parameters for Manual Operation
- Index of Refraction (IOR)
- The IOR converts time, measured by the OTDR, to
distance, which is displayed on the trace - Entering the appropriate value into the OTDR
will ensure accurate length measurements for the
fiber.
34
How to select the right OTDR Test Module
OTDR modules are primarily specified in terms of
dynamic range Select the optimum test module as
follows
- Determine the longest span you will be testing w/
this module - Determine the expected link loss budget this will
translate to - Select the module by subtracting 6 dB from the
rated dynamic range of the module (this is the
range of the unit to view backscatter signal or
measure a splice loss)
35
Example Link Loss / OTDR Module selection
calculation
Calculation Factors Link example calculations
Longest span length 75km
Avg fiber span loss 0.33dB/km _at_ 1310nm x 75 24.75dB 0.20dB/km _at_ 1550nm x 75 15dB
Connector Loss Typically 2 connectors per span 2 x 0.5dB each 1dB
Splice Loss Typically lt 0.1dB per splice w/ 1 splice per 5 km of fiber 75 / 5 15 splices x 0.1dB each 1.5dB
dB adjustment OTDR module DR Recommend allowing 6 dB for splice loss measurement
1310nm 1550nm
dB dB
24.75 15
1 1
1.5 1.5
6 6
33.25 23.5
Dynamic Range requirement for Module
36
Tools to Optimize OTDR testing
- Launch Cable
- Using a launch cable allows the characterization
of the connector at the origin of the link. - This shifts the first connector outside the dead
zone of the OTDR connector - The last connector can also be measured by using
a receive cable
- About Launch Cables
- Launch cables are typically 100 1,000 meters in
length. - The length required depends upon the dead zone
performance of the OTDR. A minimum 2x the
attenuation dead zone length is recommended,
although in practice, most are much longer
37
TB6000/8000 OTDR Distance Chart
38
Fiber Characterization
- Step-by-step review
Recommended
CrystalGraphics Presentations


