
Introduction to Earth Science - PowerPoint PPT Presentation
1 / 46
Title:
Introduction to Earth Science
Description:
Title: Introduction to Earth Science Author: Frank Napolitano Last modified by: Toby Created Date: 9/5/2004 6:02:25 PM Document presentation format – PowerPoint PPT presentation
Number of Views:100
Avg rating:3.0/5.0
Title: Introduction to Earth Science
1
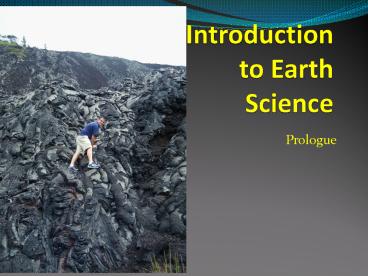
Introduction to Earth Science
- Prologue
2
- INTRODUCTION TO EARTH SCIENCE
- Earth science- -study of Earths systems
- Includes
- Meteorology
- Astronomy
- Geology
- Oceanography
3
- Presentation Outline
- What is Earth Science
- Observations vs. Inference
- Metric Measurements
- Scientific Notation
- Percent Error
- Density
- Graphing
- Rate of Change
4
- OBSERVATION-
- -Uses the 5 senses to gather information
- -We use INSTRUMENTS to extend the senses
5
What are some instruments that you have used in
science?
6
- OBSERVATION-
- -Use senses for information
- -We use INSTRUMENTS to extend the senses
- INFERENCE-
- -make a conclusion (guess)
- -making sense of observations
7
- What do you see and what do you think will happen?
8
- What do you see and where do you think this photo
was taken?
9
- Come up with an observation and an inference
based on this photo
10
- Come up with an observation and an inference
based on these photos
11
Metric MeasurementsWhat is approximately 3,000
mm?
- The height of the classroom.
- About 10 feet equals about 3 m or 3,000 mm
12
Using the ESRT
- Page 1? Metric Ruler
- Metric based on meters as unit
- In your notes order the units from largest to
smallest. - Meter
- Kilometer
- Millimeter
- Centimeter
13
Conversions
- 1 km 1000 m
- 1 m ? cm
- 1 cm ? mm
- ? cm 1 mm
14
More Metric and Units
Kittens Kilometer 1000 m
Have Hectometer 100 m
Dirty Decamater 10 m
Mouths Meter 1 m
From
Drinking Decimeter 0.1 m
Chocolate Centimeter .01 m
Milk Millimeter .001 m
15
Units
- Mass ? grams (g)
- 1000 g 1 kg 1 kg ? g
- Volume ? milliliters (ml) for liquids
- Cubic centimeters (cm3) for solids
- 1000 ml ?
- Density? mass /volume ? units ?
16
Scientific Notation
- Scientific Notation A number written as the
product of a coefficient between 1 and 10 and a
power of 10. - U238 half life 4.5 x 10⁹ years
- Diameter of an atom 2.44 x 10⁻¹⁰ m
4,500,000,000 years
0.00000000024 m
17
- Practice
- 3.5 x 10³ ______________
- 8.6 x 10⁵ _______________
- 7.4 x 10² _______________
18
- 80,000 8 x 10⁴
- 520,000,000
- 42,000,000,000,000
19
Age of Earth
- 4,600,000,000 years
- Step 1 Write this number in scientific notation
- 4.6 x10⁹ years
- Step 2 Write this in of years (text)
- 4.6 Billion Years
20
Scientific Notation on the ESRT
PAGE 1
21
PERCENT ERROR- -how wrong you are
?
Accepted value correct answer Measured value
your guess
- Temperature?
Accepted value -
measured value PCT ERROR --------------------
-------------------------- x 100
accepted value
22
How many Jelly Beans do you think there are in
the jar. Measure with your eyesThere are
__________ jellybeans.
Accepted value -
measured value PCT ERROR --------------------
-------------------------- x 100
accepted value
23
- Practice
- A student measures a table to be 1.9m long. In
reality it is 2.0m long. What is the percent
error of the student? - 2.0 1.9 X 100 5
- 2.0
A student measures a room to be 6.9m. If
the actual length is 7.5m, the students percent
error is? 7.5 6.9 X 100 8 7.5
24
Density
- Density a mass/volume ratio that does not depend
on size or shape - length 10 cm
- width 2 cm
- height 4 cm
- Volume ?
- Density mass/volume
- Density ?
Mass 240 grams
10 cm x 2 cm x 4 cm 80 cm3
240 g / 80 cm3 3 g/cm3
25
What if?
- If we cut the block into several smaller pieces,
what would the density of each piece be compared
to the original blocks density? - (1) Less
- (2) Greater
- (3) Equal
- (3) EQUAL
26
Practice
- A student determines the mass of a rock to be 196
grams, but the actual mass of the rock is 200
grams. The students approximate percent
deviation (percentage of error) is - 1.0
- 2.0
- 1.5
- 4.0
27
Density, Temperature, and Volume
- What happens to the air inside the balloon as we
heat it? - What happens to the volume? What happens to the
density? - What if we cool the air?
- Draw a graph that represents this relationship.
28
More Density Notes
240 grams
- What happens to the density of this box if you
increase the size/volume from 80 cm3 to 100 cm3?
- If you increase the size of the box/the volume
increases (and mass stays the same)? density
decreases. - You are dividing the mass by a larger number,
thus density will decrease. - Ex. 240 grams/100 cm3 2.4 g/cm3
29
Density versus Volume
- Density
- Volume
- As volume increases (when mass is constant),
density decreases. - Volume Density
- INVERSE RELATIONSHIP
30
What if you decrease volume?
- If I compress an object, what happens to its
density?
31
Which is more dense?
32
Which is more dense?
33
Which is more dense?
34
Which is more dense?
35
- Average densities
- -water 1 g/cm3 at 4o C
- below 4oC the density of water decreases.
Above 4oC, the density of water increases - -Ice 0.5 g/cm3
- -Earth 5.5 g/cm3
- -Saturn 0.7 g/cm3
- -human ?
36
Grasping Graphing
- Graph Visual display of information or data
- A way to organize and arrange data to be easily
understood - 3 main graphs (used in science) are bar, line,
pie
37
Parts of a Graph
- Independent variable x axis
- Ex. Time- causes change in the dependent variable
- Dependent Variable y axis
- Ex. Temperature- this experiences the result of
(or depends on) the independent variable - Title compares the dependent variable to the
independent (y versus x)
38
LINE GRAPHS
- Data changes due to a relationship
- Ex. temperature changes over time
- Average Daily Temperature for January 1-7 in
Degrees Fahrenheit - Date Temperature (F)
- 1 10
- 2 25
- 3 30
- 4 42
- 5 23
- 6 25
- 7 40
39
BAR GRAPHS
- Compare information collected by counting
- Favorite Student After School Activity
- Activity Number
- Visit W/Friends 175
- Talk on Phone 168
- Play Sports 120
- Earn Money 120
- Use Computers 65
40
PIE CHART/CIRCLE GRAPH
- Slices represent percentages of the total
41
Graph Relationships
- Direct as x increases, y increases
- Indirect as x increases, y decreases
- Constant as x increases, y stays the same
- Cyclic it repeats in a predictable pattern
- Example the tides due to moons gravity
- Example temperature vs. time of day (see sheet)
42
- Types of graphs
- -line graphs
- direct indirect or inverse cyclic
- relationship relationship
relationship
43
Rate of Change
- Rate of Change the amount of change in a field
that occurs over time - R.O.C change / time
- Example 6 am temp 55 F
- 2 pm temp 82 F
- Change in temp 82-55 27 F
- Change in time 8 hours
- Rate of change 3.4 F/ hour
44
Rate of Change
- What is the rate of change here?
45
- example
- From 300 pm to 600 pm the air temperature
falls from 85oF to 79oF. What is the rate of
change for temperature during this time? - Rate of change
- In 60 years, the shoreline at Rye Beach has
shrunk by 30 inches. What is the rate of change
for the shoreline? - Rate of Change
46
- Presentation Conclusion
- What is Earth Science
- Observations vs. Inference
- Metric Measurements
- Scientific Notation
- Percent Error
- Density
- Graphing
- Rate of Change
Recommended
CrystalGraphics Presentations


