
Prevalence: HIV/AIDS, by County - PowerPoint PPT Presentation
1 / 4
Title:
Prevalence: HIV/AIDS, by County
Description:
Prevalence: HIV/AIDS, by County a- Pima b- Maricopa c- Pinal* d- Mohave e- Cochise f- La Paz g- Coconino h- Graham* i- Sta Cruz j- Yuma k- Yavapai l- Gila – PowerPoint PPT presentation
Number of Views:143
Avg rating:3.0/5.0
Title: Prevalence: HIV/AIDS, by County
1
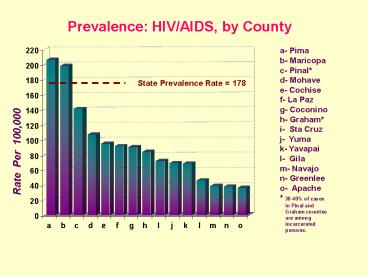
Prevalence HIV/AIDS, by County
a- Pima b- Maricopa c- Pinal d- Mohave e-
Cochise f- La Paz g- Coconino h- Graham i- Sta
Cruz j- Yuma k- Yavapai l- Gila m- Navajo n-
Greenlee o- Apache 30-40 of cases in
Pinal and Graham counties are among
incarcerated persons.
State Prevalence Rate 178
Rate Per 100,000
2
Incidence New HIV/AIDS Cases 1998-2002, by County
a- Maricopa b- Pima c- Pinal d- Graham e- La
Paz f- Mohave g- Sta Cruz h-Yavapai i- Coconino
j- Cochise k- Navajo l- Yuma m- Gila n-
Apache o- Greenlee 30-40 of cases in Pinal
and Graham counties are among
incarcerated persons.
State Incidence Rate 13.3
Rate Per 100,000
3
HIV/AIDS Events Per Year in Arizona, 1981-2002
HIV Diagnosis
AIDS Diagnosis
Number of Cases Resident in Arizona
deceased
Year of Event HIV Diagnosis, AIDS Diagnosis,
Death
4
Incidence of New HIV/AIDS Diagnoses in Arizona
1998-2002