
Applications - PowerPoint PPT Presentation
Title:
Applications
Description:
Wellcome Trust Animal Health Research: Recent Developments & Future Directions The Gridded Livestock of the World Database William Wint1, Joachim Otte2, Jan ... – PowerPoint PPT presentation
Number of Views:23
Avg rating:3.0/5.0
Title: Applications
1
Wellcome Trust Animal Health Research Recent
Developments Future Directions
The Gridded Livestock of the World
Database William Wint1, Joachim Otte2, Jan
Slingenbergh2, Gianluca Franceschini2 and Tim
Robinson2 1 Environmental Research Group, Oxford.
Department of Zoology, South Parks Road, Oxford
OX1 3PS. william.wint_at_zoo.ox.ac.uk 2 Animal
Production and Health Division, Food and
Agriculture Organisation of the United Nations,
Viale delle Terme di Caracalla, 00531, Rome,
Italy.
The data processing and analysis chain
Abstract Quantifying animal disease levels is
frequently hampered not only by a lack of
publicly available disease data, but also by the
complete absence of readily available
standardised animal population data that can be
used as the denominator in calculating and
mapping disease levels. This is true of both
high and low income countries. In an attempt to
address this shortfall in the basic information
needed to evaluate animal disease risk, FAOs
Animal Production and Health Division has, in
collaboration with the Environmental Research
Group Oxford (ERGO), developed the Gridded
Livestock of the World (GLW) database the first
standardised global, sub-national resolution maps
of the major agricultural livestock
species. These are now freely available for
download via FAOs web pages (see below), in ESRI
grid format for cattle, buffalo, sheep, goats,
pigs and poultry/chickens. The map values are
animal densities per square kilometre, at a
resolution of 3 minutes of arc (approximately 5km
at the equator), and are derived from official
census and survey data, from a combination of
suitability masking and spatial disaggregation of
the reported livestock data by statistical
modelling of livestock numbers based on empirical
relationships between livestock densities and
environmental variables in similar
agro-ecological zones.
Obtaining the livestock distribution data The
livestock distribution data are freely available
for download via the Gridded Livestock of the
World website. The data come with supplementary
overlay files, quick-looks and prepared graphics,
and are fully described in their metadata. A
publication will be available early in 2007,
which can be requested via the website, that
details the methodology, datasets and many of the
applications in which these data have been used
to date. www.fao.org/ag/AGAinfo/resources/en/glw/
default.html
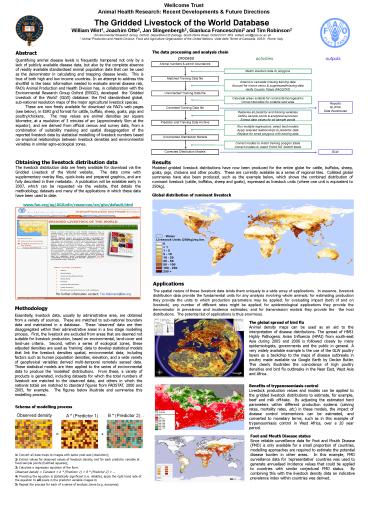
Results Modeled gridded livestock distributions
have now been produced for the entire globe for
cattle, buffalos, sheep, goats, pigs, chickens
and other poultry. These are currently available
as a series of regional tiles. Collated global
summaries have also been produced, such as the
example below, which shows the combined
distribution of ruminant livestock (cattle,
buffalos, sheep and goats), expressed as
livestock units (where one unit is equivalent to
250kg).
Global distribution of ruminant livestock
Applications The spatial nature of these
livestock data lends them uniquely to a wide
array of applications. In essence, livestock
distribution data provide the fundamental units
for any analysis involving whole animals for
estimating production they provide the units to
which production parameters may be applied for
evaluating impact (both of and on livestock), any
number of different rates might be applied for
epidemiological applications they provide the
denominator in prevalence and incidence
estimates and for transmission models they
provide the the host distributions. The
potential list of applications is thus enormous.
For further information contact
Tim.Robinson_at_fao.org
Methodology Essentially, livestock data, usually
by administrative area, are obtained from a
variety of sources. These are matched to
sub-national boundary data and maintained in a
database. These observed data are then
disaggregated within their administrative areas
in a two stage modelling process. First, the
livestock are excluded from areas that are deemed
not suitable for livestock production, based on
environmental, land-cover and land-use criteria.
Second, within a series of ecological zones,
these adjusted densities are used as training
data to develop statistical models that link the
livestock densities spatial, environmental data
including factors such as human population
densities, elevation, and a wide variety of
geophysical variables derived multi-temporal
remotely sensed data. These statistical models
are then applied to the series of environmental
data to produce the modelled distributions.
From these, a variety of products is generated,
including datasets for which the total numbers of
livestock are matched to the observed data, and
others in which the national totals are matched
to standard figures from FAOSTAT, 2000 and 2005,
for example. The figures below illustrate and
summarise this modelling process.
The global spread of bird flu Animal density maps
can be used as an aid to the interpretation of
disease distributions. The spread of HN51 Highly
Pathogenic Avian Influenza (HPAI) from south-east
Asia during 2005 and 2006 is followed closely by
many epidemiologists, governments and the public
in general. A very widely available example is
the use of the GLW poultry layers as a backdrop
to the maps of disease outbreaks in poultry made
available via Google Earth by Declan Butler.
This clearly illustrates the coincidence of high
poultry densities and bird flu outbreaks in the
Near East, West Asia and Africa.
Benefits of trypanosomiasis control Livestock
production values and models can be applied to
the gridded livestock distributions to estimate,
for example, beef and milk off-take. By
adjusting the estimated herd parameters within
different production systems (calving rates,
mortality rates, etc.) in these models, the
impact of disease control interventions can be
estimated, and converted to monetary terms, such
as in this example of trypanosomiasis control in
West Africa, over a 20 year period.
Schema of modelling process
Foot and Mouth Disease status Since reliable
surveillance data for Foot and Mouth Disease
(FMD) is only available for a small proportion of
countries, modelling approaches are required to
estimate the potential disease burden in other
areas. In this example, FMD surveillance data
for representative countries was used to
generate annualised incidence values that could
be applied to countries with similar conjectural
FMD status. By combining this with the livestock
density data an indicative prevalence index
within countries was derived.
1 Convert all data maps to images with same
pixel size (resolution) 2 Extract values for
observed values of livestock density, and for
each predictor variable at fixed sample points
(hatched squares) 3 Calculate a regression
equation of the form Observed density
Constant A (Predictor 1) B (Predictor 2)
... 4 Providing the equation is statistically
significant (i.e. reliable), apply the right hand
side of the equation to all pixels in the
predictor variable images to 5 Repeat the
process for each of a series of analysis zones
(e.g. ecozones).
Recommended
CrystalGraphics Presentations


