
Limited Dependent Variables - PowerPoint PPT Presentation
1 / 23
Title:
Limited Dependent Variables
Description:
Limited Dependent Variables Often there are occasions where we are interested in explaining a dependent variable that has only limited measurement – PowerPoint PPT presentation
Number of Views:64
Avg rating:3.0/5.0
Title: Limited Dependent Variables
1
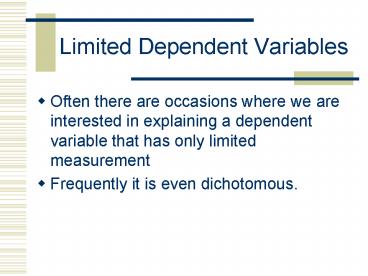
Limited Dependent Variables
- Often there are occasions where we are interested
in explaining a dependent variable that has only
limited measurement - Frequently it is even dichotomous.
2
Examples
- War(1) vs. no War(0)
- Vote vs. no vote
- Regime change vs. no change
3
These are often Probability Models
- E.g.
- Power disparity leads to war
- Where Yt is the occurrence (or not) of war, and
Xt is a measure of power disparity - We call this a Linear Probability Model
4
Problems with LPM Regression
- OLS in this case is called the Linear Probability
Model - Running regression produces some problems
- Errors are not distributed normally
- Errors are heteroskedastic
- Predicted Ys can be outside the 0.0-1. bounds
required for probability
5
Logistic Model
- We need a model that produces true probabilities
- The Logit, or cumulative logistic distribution
offers one approach. - This produces a sigmoid curve.
- Look at equation under 2 conditions
- Xi 8
- Xi -8
6
Sigmoid curve
7
Probability Ratio
- Note that
- Where
8
Log Odds Ratio
- The logit is the log of the odds ratio, and is
given by - This model gives us a coefficient that may be
interpreted as a change in the weighted odds of
the dependent variable
9
Estimation of Model
- We estimate this with maximum likelihood
- The significance tests are z statistics
- We can generate a Pseudo R2 which is an attempt
to measure the percent of variation of the
underlying logit function explained by the
independent variables - We test the full model with the Likelihood Ratio
test (LR), which has a ?2 distribution with k
degrees of freedom
10
Neural Networks
- The alternate formulation is representative of a
single-layer perceptron in an artificial neural
network.
11
Probit
- If we can assume that the dependent variable is
actually the result of an underlying (and
immeasurable) propensity or utility, we can use
the cumulative normal probability function to
estimate a Probit model - Also, more appropriate if the categories (or
their propensities) are likely to be normally
distributed - It looks just like a logit model in practice
12
The Cumulative Normal Density Function
- The normal distribution is given by
- The Cumulative Normal Density Function is
13
The Standard Normal CDF
- We assume that there is an underlying threshold
value (Ii) that if the case exceeds will be a 1,
and 0 otherwise. - We can standardize and estimate this as
14
Probit estimates
- Again, maximum likelihood estimation
- Again, a Pseudo R2
- Again, a LR ratio with k degrees of freedom
15
Assumptions of Models
- All Ys are in 0,1 set
- They are statistically independent
- No multicollinearity
- The P(Yi1) is normal density for probit, and
logistic function for logit
16
Ordered Probit
- If the dependent variable can take on ordinal
levels, we can extend the dichotomous Probit
model to an n-chotomous, or ordered, Probit model - It simply has several threshold values estimated
- Ordered logit works much the same way
17
Multinomial Logit
- If our dependent variable takes on different
values, but they are nominal, this is a
multinomial logit model
18
Some additional info
- The Modal category is good benchmark
- Present correctly predicted
- This can be calculated and presented.
- This, when compared to the modal category, gives
us a good indication of fit.
19
Stata
- Use Leadership Change data
- (1992 cross section) 1992-Stata
20
Test different models
- Dependent variable Leadership change
- Examine distribution
- tables ledchan1
- Independent variables
- Try different
- Try corr and then (pwcorr)
21
Try the following
- regress ledchan1 grwthgdp hlthexp illit_f polity2
- logit ledchan1 grwthgdp hlthexp illit_f polity2
- logistic ledchan1 grwthgdp hlthexp illit_f
polity2 - probit ledchan1 grwthgdp hlthexp illit_f polity2
- ologit ledchan1 grwthgdp hlthexp illit_f polity2
- oprobit ledchan1 grwthgdp hlthexp illit_f
polity2 - mlogit ledchan1 grwthgdp hlthexp illit_f polity2
- tobit ledchan1 grwthgdp hlthexp illit_f polity2,
ul ll
22
Tobit
- Assumes a 0 value, and then a scale
- E.g., the decision to incarcerate
- 0 or 1
- (Imprison or not)
- If Imprison, than for how many years?
23
Other models
- This leads to many other models
- Count models Poisson regression
- Duration/Survival/hazard models
- Censoring and truncation models
- Selection bias models
Recommended
CrystalGraphics Presentations


