
Diapositiva 1 - PowerPoint PPT Presentation
1 / 25
Title:
Diapositiva 1
Description:
Congestion and social welfare in zonal markets Load offer prices are indicative of the value of the goods produced Generators bid prices ... thermoelectric generation ... – PowerPoint PPT presentation
Number of Views:32
Avg rating:3.0/5.0
Title: Diapositiva 1
1
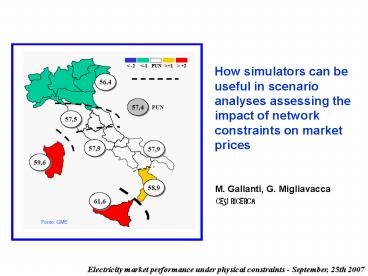
How simulators can be useful in scenario analyses
assessing the impact of network constraints on
market prices
M. Gallanti, G. Migliavacca
CESI RICERCA
Electricity market performance under physical
constraints - September, 25th 2007
2
Index
- Introduction of the Italian market (IPEX) the
PUN and its effects - Impact of congestion on market efficiency and
market power - Effects of increasing transmission capacity
between zones - Aims and methodologies of market simulation
- SREMS a tool to investigate strategic competition
3
The Italian day-ahead electricity market
- The Italian Power EXchange (IPEX) is operative
since April 1st, 2004 and features three physical
markets (day-ahead, adjustment, ancillary
services). - The day-ahead is zonal, structured in 22 zones (7
geographical, 6 limited production poles and 9
border virtual zones). Market splitting is used
for congestion management. - It is a non-compulsory (mixed) market both spot
market and bilateral physical contracts are
allowed.
4
The Italian day-ahead electricity market
- Zonal sell prices in the IPEX in the last year
Source GME monthly report - July 2007
5
The Uniform Purchase Price (PUN)
- Unique feature generated power paid at the zonal
price, while purchase price is uniform on the
national territory (PUN Prezzo Unico
Nazionale). The PUN is obtained as an average of
all zonal sale prices weighed with the purchase
volumes.
Yes
Inter-zonal transmission constraints respected?
No
Calculation of energy exchanges between zones
Separation of the market in zones
Injection and withdrawal programs compatible with
the constraints
- zonal sale prices
- uniform purchase price
Sale and purchase bids
6
Some important side-effects of the PUN
- The PUN destroys any locational signals given to
the load (while they remain on generation). - With the PUN the concept of congestion rent
becomes opaque and difficult to understand by
market operators. - The grid structure and power plants distribution
among generating companies in the different areas
may determine market concentration in some areas. - Local Market concentration may turn out in local
market power - In Italy the incumbent generation share is very
significant in the South - The PUN introduces further incentives to exercise
local market power - Suppose a zonal system with one exporting zone
(A) and one importing zone (B). Demand elasticity
and competition would act discouraging GenCos
from raising prices in B, even if pivotal a
GenCo that is not monopolist in B by raising
prices would give up part of its production in
favor of its competitors, with a possible loss of
profits. - The PUN weakens this effect loads in B pay the
PUN, that is lower than the relevant zonal price.
- The greater the demand in A wrt B, the weaker the
influence of zonal price in B onto the PUN.
7
Effects of network congestion on prices
- Since the opening of the Italian market, CESI
RICERCA has studied the effects of network
congestion on the electricity prices - The economic impact of the unavailability of the
Matera S. Sofia line was assessed through a
market simulator (fall 2004) .
Price duration curve (simulated) in the South
zone without the Matera - S. Sofia line
8
Effects of network congestion on prices
- Price reduction duration curve (simulated) in the
South zone due to the presence of the Matera - S.
Sofia line. - The availability of the Matera S. Sofia line
made it possible to increase the the transits
capacity among the zones
The return for the consumers would have been an
annual cost reduction of 40 M. The total cost of
the Matera - S. Sofia line was estimated around
100M.
9
Congestion and social welfare in zonal markets
Load offer prices are indicative of the value of
the goods produced
Generators bid prices should be indicative of
the costs for producing energy
- The merchandise surplus corresponds
- to the congestion rent extracted by the
- TSO.
- The dead-weight loss is an indicator of
- efficiency loss in the market due to
- congestion.
Congestion means lower market efficiency
10
Effects of an increase of interzonal capacity
- Increasing the capacity of
- congested tie-lines decreases the
- dead-weight loss and increases the
- social welfare. The market solution
- is more efficient.
- However, the increase of social welfare (AgtB) is
not necessarily matched with a reduction of loads
payments. In this example - if pure zonal market loads in the export zone
pay price p2 gtp1, those in import zone pay the
same - if PUN is introduced all the loads pay more
(the weighed average grows).
p
p
B
A
p3
p2
p1
q
Export zone
Import zone
q
11
Congestions and market power
- Market power can be exercised both at global
(market) level and locally. - Textbook definition of local market power
consists in a producer actuating bidding
behaviors such as to artificially cause
congestion between market zones. In this way, he
prevents the import of cheaper energy from other
zones and creates pivotality conditions for its
own local generators in the importer zone. The
action of creating congestion may be not
profitable in itself, but the sum with the
exercise of market power by local generators
turns up to be very profitable.
- This kind of local market power may only be
exercised in meshed networks, not in tree-like
ones (as the Italian market)
A
B
1. Create a saturation between A and B
C
A
By saturating A-B, B receives more power. Either
it uses it locally or exports it to C. In both
cases, C imports the same power or more and this
reduces (or doesnt increase) the pivotality of
local generators.
B
C
2. C cant import any longer (parallel flows)
local generators are pivotal
12
Congestions and market power
- However, this does not mean that a producer with
market power on the whole national territory
cannot find it profitable to congest one or
several connections. By comparing the results of
perfect and strategic competition in simulations
carried out with SREMS, we see there are several
hours in which the leader could strategically
congests the tie line between Sicily and
continent. - One example
DL-186 MW DF229 MW
DQ43
Perfect competition P 48.61 /MWh Strategic
competition P 50.34 /MWh P(Sicily)59.31
/MWh The leader increases his surplus by 60.8
k
43
DL0 DF0
DL0 DF0
43 (saturated)
DL-43 DF0
13
What are market simulators
- Electricity market simulators are used to
forecast market results under given scenario
hypotheses, like - fuel prices
- characteristics of generators, distribution on
the territory and among the generation firms - characteristics of the transmission network
(transit limits) - legislation (e.g. emissions of pollutants)
- Simulators are classified by their reference
time horizon
14
Who uses market simulators
15
Market analysis tools
Data analysis to examine past market behavior by
means of indices and different data aggregations
Optimization tools least cost generation
decisions, once provided supply and demand
schedules, keeping into account operational
constraints
Price forecasting tools extrapolating market
results to the future (ARMAX, etc)
Suppliers strategy models simulation using games
theory (Cournot, Bertrand, Stackelberg, Supply
Function Equilibrium, conjectural variations)
16
Main features of SREMS
- SREMS is a short-medium run electricity market
simulator based on game theory. - SREMS calculates price makers hourly strategic
bids, supposing they actuate both a bid-up and a
capacity withholding strategy. Additionally, it
allows to define a certain number of price
takers. - Demand is inelastic, defined hour by hour and
zone by zone. - The network is supposed non-meshed (tree-like).
Nodes represent market zones separated by
interconnectors with min/max transit limits. - The electricity market is modeled with hourly
detail, but the scheduling of reservoir hydro and
pumping power plants is carried out monthly. - Characteristics of thermal power plants are
taken into account with a high level of realism
(quadratic cost curves, maintenance periods,
accidental outages). - Each producer can appoint a percentage of his
power to physical bilateral contracts, function
of total load, market share and attitude towards
the risk.
17
- Input XLS file
- load, limits of transit
- generators characteristics
- calendar of maintenances
- monthly production and
- pumping of hydro power plants
- overall bilaterals percentage
M 1
COMPETITIVE LOAD
H 1
Month end
18
Preferential transactions and hydro plants
19
Unit Commitment of thermal power plants
- Setting up a UC strategy for a producer is very
complex. Many aspects have to be considered - If the sum of minima of all committed generators
is higher than the load, price is zero (even
variable costs are not recovered) and the
generators must bid in the adjustment market. - In general, too much committed power generates
low prices. However, generators are also
interested to have many plants committed to
maximize produced power. - Load changes along the day during the night few
plants should be on (sum of technical minima must
stay below the load), while during the day power
should be available to catch peaking prices.
However, flexibility to switch on and off is
limited and depends from the plant technology.
20
Strategic competition the algorithm Vampiro
- Lets suppose a leader knows the bids of all his
competitors and, on the basis of them he wants to
calculate the most favorable market solution
(highest producer surplus), in terms of produced
quantity and zonal prices. - Vampiro solves this problem resorting to the
following logical steps - write market clearing problem,
- translate it into a set of equilibrium
conditions, - write producers problem,
- solve the latter adding the equilibrium
conditions of the market clearing problem as a
set of additional constraints.
The resulting optimization problem is not convex
local minima do exist!
21
Strategic competition calculating bids
- Then, it is necessary to translate the
information on leaders optimal quantities into
an optimal bidding strategy (price-quantity)
capable to induce the optimal market clearing.
22
Typical trend of one week of zonal hourly prices
23
A simulation of the Italian market
- Aim of the simulation is to assess the economical
benefits that an enlargement by 300MW of the
maximum allowed transit on the connector between
Sicily and continent. - Benefits are measured in terms of total saving of
the customers against value of the investment in
new infrastructures (1.8 M/km x 40 km 72 M
additional expenditures 80 M). - The simulations have been built upon a scenario
2005 of the Italian market - 19 GenCos, 170 thermal units, 53 hydro units
- 4 macro-zones (Nord, Centro-Sud, Sicilia,
Sardegna) - fuel prices 26.14 /Gcal (oil), 31.55 /Gcal
(methane) - real hourly load assigned to each macrozone
- max bid price tuned on real market price peaks
- monthly CIP6 and import provided as input data.
- Preliminary simulation results show that
investment costs could be recovered in less than
two years. However, the non-convexity of the
problem solved by Vampiro invites to some
precaution in reading the results of comparative
simulations (like this one).
24
Conclusions
- SREMS is a reliable tool allowing to perform
scenario analyses on real electricity markets
over a short-medium run time horizon and to
assess the capability of the market leaders to
exercise market power, both market-wide and at
local level. The true challenge would be to
incorporate real strategies instead of sheer
profit maximization, to make the market
equilibrium model acquire a true predictive role.
No literature paper has tackled the problem yet. - On the basis of simulations, building
inter-zonal tie lines to decongest the most
critical connectors would probably create an
amount of benefit sufficient to recover
investment costs in few years. Increasing TTC
between zones would also make the market more
efficient and the exercise of market power more
difficult.
25
Thank you for your attention...
Massimo GallantiGianluigi Migliavacca CESI
RICERCA via Rubattino,54 20134 Milano
(Italy) E-mail massimo.gallanti_at_cesiricerca.it
gianluigi.migliavacca_at_cesiricerca.it
Recommended
CrystalGraphics Presentations


