Linear Regression Analysis - PowerPoint PPT Presentation

1 / 22
Title:
Linear Regression Analysis
Description:
Linear Regression Analysis Political Science 102 Introduction to Political Inquiry Lecture 21 Regression Analysis Regression analysis is the predominant ... – PowerPoint PPT presentation
Number of Views:74
Avg rating:3.0/5.0
Title: Linear Regression Analysis
1
Linear Regression Analysis
- Political Science 102 Introduction to Political
Inquiry - Lecture 21
2
Regression Analysis
- Regression analysis is the predominant
statistical tool used in the social sciences - Simple and versatile
- AKA linear regression, ordinary least squares,
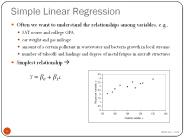
OLS - Central concept is fitting a line through data to
describe relationships between X and Y
3
Notations for Regression Line
- Mathematical notations for the straight line
- 10th Grade Geometry
- Statistics Literature
- Econometrics Literature
- These are all equivalent statements
- We may use stats or and econ notation for the
model. - Just remember that B0 and a are the same thing.
4
Translating Math into English
- Linear model implies that the dependent variable
is directly proportional to the independent
variable. - A theory implying that Y increases in direct
proportion to an increase in X, implies a
specific mathematical model of behavior - the
linear model. - Example Economic performance and incumbent vote
share - ALL statements of relationships between variables
imply a mathematical structure. - Even if we dont like to phrase our theories in
these terms, they DO imply mathematical
relationships - Courses in regression analysis are about making
this basic linear model fit more nuanced theories
5
The Regression Parameters
- a the intercept
- the point where the line crosses the Y-axis.
- (the value of the dependent variable when all of
the independent variables 0) - b the slope
- the increase in the dependent variable per unit
change in the independent variable (also known as
the 'rise over the run') - Ordinary Least Squares (OLS) is a method of
finding the parameters a b that define the line
of best fit between variables - Line that provides the best explanation/prediction
of the data - Determined by minimizing the squared errors
around the line
6
Determining the Line of Best Fit
7
Determining the Line of Best Fit
8
Finding the Line of Best Fit
Total Variation Explained Variation
Unexplained Variation
9
Finding the Line of Best Fit
Line that fits the data BEST will minimize the
unexplained variation (USS)
Regression analysis estimates the slope and
intercept (labeled here as b1 and b2) that
minimizes USS
10
The OLS Estimatorsfor the Slope and Intercept
11
Understanding what makes b
- Numerator of b is made of of TWO parts
- Deviations of X from its mean
- Deviations of Y from its mean
- Denominator of b is made up of the deviation of x
from its mean times itself - Thus b is made of of changes in X times changes
in Y, divided by changes in X squared - A.K.A rise over run
12
Understanding What Makes b
- Notice if the changes in X are EQUAL to the
changes in y, then b 1 - If the changes in Y are LARGER than the changes
in X, then b gt 1 - I.E. a 1 unit change in X creates more than a 1
unit change in Y - If the changes in Y are SMALLER than the changes
in X, then b lt 1 - I.E. a 1 unit change in X creates less than a 1
unit change in Y
13
Understanding What Makes b
- This corresponds to our intuitive understanding
of the slope of a line - How much change in Y do we observe for each
change in X? - We can also see how b is calculated in units of
the dependent variable. - It is changes in the dependent variable over
changes in the independent variable
14
Lets Do An Example!
15
Calculating a and b
- Mean of X is 4
- Mean of Y is 14
16
Calculating a and b
b186/62 b3
17
Calculating a and b
a 14-3(4) a 2
Mean of Y 14 Mean of X 4
Our regression line is Y 2 3X
18
Which Looks Like This!
19
Lets Replicate Sigelman onPresidential
Popularity and Incumbent Vote
20
Presidential Popularity and Incumbent Vote Share
1940-1976
21
OLS Estimation of the Slope and Intercept
. reg presvoteshare prespop Source
SS df MS Number of obs
7 -----------------------------------------
-- F( 1, 5) 5.93 Model
81.8436927 1 81.8436927 Prob gt
F 0.0590 Residual 68.9734383 5
13.7946877 R-squared
0.5427 ------------------------------------------
- Adj R-squared 0.4512 Total
150.817131 6 25.1361885 Root
MSE 3.7141 ------------------------------
------------------------------------------------ p
resvoteshe Coef. Std. Err. t
Pgtt 95 Conf. Interval ------------------
--------------------------------------------------
--------- prespop .2908594 .1194116
2.44 0.059 -.0160978 .5978167
_cons 37.96525 7.150323 5.31 0.003
19.58476 56.34574 ----------------------------
--------------------------------------------------
Incumbent Vote Share 37.97 0.291(Last
Popularity Rating)
22
The OLS Regression Line of Best Fit
Recommended
CrystalGraphics Presentations