
Future value - PowerPoint PPT Presentation
Title: Future value
1
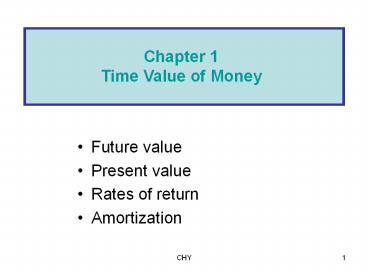
Chapter 1 Time Value of Money
- Future value
- Present value
- Rates of return
- Amortization
2
- Time lines show timing of cash flows.
0
1
2
3
i
CF0
CF1
CF3
CF2
Tick marks at ends of periods, so Time 0 is
today Time 1 is the end of Period 1 or the
beginning of Period 2.
3
Time line for a 100 lump sum due at the end of
Year 2.
0
1
2 Year
i
100
4
Time line for an ordinary annuity of 100 for 3
years.
0
1
2
3
i
100
100
100
5
Time line for uneven CFs -50 at t 0 and 100,
75, and 50 at the end of Years 1 through 3.
0
1
2
3
i
100
50
75
-50
6
Whats the FV of an initial 100 after 3 years if
i 10?
0
1
2
3
10
FV ?
100
Finding FVs (moving to the right on a time line)
is called compounding.
7
After 1 year
FV1 PV INT1 PV PV (i) PV(1 i)
100(1.10) 110.00.
After 2 years
FV2 FV1(1i) PV(1 i)(1i) PV(1i)2
100(1.10)2 121.00.
8
After 3 years
FV3 FV2(1i)PV(1 i)2(1i) PV(1i)3
100(1.10)3 133.10.
In general,
FVn PV(1 i)n.
9
Three Ways to Find FVs
- Solve the equation with a regular calculator.
- Use a financial calculator.
- Use a spreadsheet.
10
Financial calculator HP17BII
- Adjust display contrast hold down CLR and push
or -. - Choose algebra mode Hold down orange key (i.e.,
the shift key), hit MODES (the shifted DSP key),
and select ALG. - Set number of decimal places to display Hit DSP
key, select FIX, then input desired decimal
places (e.g., 3).
11
HP17BII (Continued)
- Set decimal mode Hit DSP key, select the .
instead of the ,. Note many non-US countries
reverse the US use of decimals and commas when
writing a number.
12
HP17BII Set Time Value Parameters
- Hit EXIT until you get the menu starting with
FIN. Select FIN. - Select TVM.
- Select OTHER.
- Select P/YR. Input 1 (for 1 payment per year).
- Select END (for cash flows occuring at the end of
the year.)
13
Financial Calculator Solution
Financial calculators solve this equation
There are 4 variables. If 3 are known, the
calculator will solve for the 4th.
14
Heres the setup to find FV
INPUTS
3 10 -100 0 N I/YR PV PMT FV
133.10
OUTPUT
Clearing automatically sets everything to 0, but
for safety enter PMT 0.
Set P/YR 1, END.
15
Spreadsheet Solution
- Use the FV function see spreadsheet in Ch 02
Mini Case.xls. - FV(Rate, Nper, Pmt, PV)
- FV(0.10, 3, 0, -100) 133.10
16
Whats the PV of 100 due in 3 years if i 10?
Finding PVs is discounting, and its the reverse
of compounding.
0
1
2
3
10
100
PV ?
17
Solve FVn PV(1 i )n for PV
3
1
?
?
?
PV
100
?
?
?
1.10
?
?
100
0.7513
75.13.
18
Financial Calculator Solution
INPUTS
3 10 0 100 N I/YR PV
PMT FV -75.13
OUTPUT
Either PV or FV must be negative. Here PV
-75.13. Put in 75.13 today, take out 100
after 3 years.
19
Spreadsheet Solution
- Use the PV function see spreadsheet.
- PV(Rate, Nper, Pmt, FV)
- PV(0.10, 3, 0, 100) -75.13
20
Finding the Time to Double
0
1
2
?
20
2
-1
FV PV(1 i)n 2 1(1
0.20)n (1.2)n 2/1 2 nLN(1.2) LN(2)
n LN(2)/LN(1.2) n
0.693/0.182 3.8.
21
Financial Calculator
INPUTS
20 -1 0 2 N I/YR PV
PMT FV 3.8
OUTPUT
22
Spreadsheet Solution
- Use the NPER function see spreadsheet.
- NPER(Rate, Pmt, PV, FV)
- NPER(0.10, 0, -1, 2) 3.8
23
Finding the Interest Rate
0
1
2
3
?
2
-1
FV PV(1 i)n 2 1(1
i)3 (2)(1/3) (1 i) 1.2599 (1 i)
i 0.2599 25.99.
24
Financial Calculator
INPUTS
3 -1 0 2 N I/YR PV
PMT FV 25.99
OUTPUT
25
Spreadsheet Solution
- Use the RATE function
- RATE(Nper, Pmt, PV, FV)
- RATE(3, 0, -1, 2) 0.2599
26
Whats the difference between an ordinary annuity
and an annuity due?
Ordinary Annuity
0
1
2
3
i
PMT
PMT
PMT
Annuity Due
0
1
2
3
i
PMT
PMT
PMT
PV
FV
27
Whats the FV of a 3-year ordinary annuity of
100 at 10?
0
1
2
3
10
100
100
100
110 121 FV 331
28
FV Annuity Formula
- The future value of an annuity with n periods and
an interest rate of i can be found with the
following formula
29
Financial Calculator Formula for Annuities
Financial calculators solve this equation
There are 5 variables. If 4 are known, the
calculator will solve for the 5th.
30
Financial Calculator Solution
INPUTS
3 10 0 -100 331.00
N
I/YR
PV
PMT
FV
OUTPUT
Have payments but no lump sum PV, so enter 0 for
present value.
31
Spreadsheet Solution
- Use the FV function see spreadsheet.
- FV(Rate, Nper, Pmt, Pv)
- FV(0.10, 3, -100, 0) 331.00
32
Whats the PV of this ordinary annuity?
0
1
2
3
10
100
100
100
90.91
82.64
75.13
248.69 PV
33
PV Annuity Formula
- The present value of an annuity with n periods
and an interest rate of i can be found with the
following formula
34
Financial Calculator Solution
INPUTS
3 10 100 0
N
I/YR
PV
PMT
FV
OUTPUT
-248.69
Have payments but no lump sum FV, so enter 0 for
future value.
35
Spreadsheet Solution
- Use the PV function see spreadsheet.
- PV(Rate, Nper, Pmt, Fv)
- PV(0.10, 3, 100, 0) -248.69
36
Find the FV and PV if theannuity were an annuity
due.
0
1
2
3
10
100
100
100
37
PV and FV of Annuity Due vs. Ordinary Annuity
- PV of annuity due
- (PV of ordinary annuity) (1i)
- (248.69) (1 0.10) 273.56
- FV of annuity due
- (FV of ordinary annuity) (1i)
- (331.00) (1 0.10) 364.1
38
Switch from End to Begin. Then enter
variables to find PVA3 273.55.
INPUTS
3 10 100 0
-273.55
N
I/YR
PV
PMT
FV
OUTPUT
Then enter PV 0 and press FV to find FV
364.10.
39
Excel Function for Annuities Due
Change the formula to PV(10,3,-100,0,1) The
fourth term, 0, tells the function there are no
other cash flows. The fifth term tells the
function that it is an annuity due. A similar
function gives the future value of an annuity
due FV(10,3,-100,0,1)
40
What is the PV of this uneven cashflow stream?
4
0
1
2
3
10
100
300
300
-50
90.91
247.93
225.39
-34.15
530.08 PV
41
- Input in CFLO register
- CF0 0
- CF1 100
- CF2 300
- CF3 300
- CF4 -50
- Enter I 10, then press NPV button to get NPV
530.09. (Here NPV PV.)
42
Spreadsheet Solution
A B C D E 1 0 1 2 3 4 2 100 300 300 -50 3 53
0.09
Excel Formula in cell A3 NPV(10,B2E2)
43
Nominal rate (iNom)
- Stated in contracts, and quoted by banks and
brokers. - Not used in calculations or shown on time lines
- Periods per year (m) must be given.
- Examples
- 8 Quarterly
- 8, Daily interest (365 days)
44
Periodic rate (iPer )
- iPer iNom/m, where m is number of compounding
periods per year. m 4 for quarterly, 12 for
monthly, and 360 or 365 for daily compounding. - Used in calculations, shown on time lines.
- Examples
- 8 quarterly iPer 8/4 2.
- 8 daily (365) iPer 8/365 0.021918.
45
Will the FV of a lump sum be larger or smaller if
we compound more often, holding the stated I
constant? Why?
LARGER! If compounding is more frequent than
once a year--for example, semiannually,
quarterly, or daily--interest is earned on
interest more often.
46
FV Formula with Different Compounding Periods
(e.g., 100 at a 12 nominal rate with semiannual
compounding for 5 years)
mn
i
?
?
Nom
FV
PV
1 .
?
?
n
?
?
m
2x5
0.12
?
?
FV
100
1
?
?
?
?
5S
2
100(1.06)10 179.08.
47
FV of 100 at a 12 nominal rate for 5 years with
different compounding
- FV(Annual) 100(1.12)5 176.23.
- FV(Semiannual) 100(1.06)10179.08.
- FV(Quarterly) 100(1.03)20 180.61.
- FV(Monthly) 100(1.01)60 181.67.
- FV(Daily) 100(1(0.12/365))(5x365)
- 182.19.
48
Effective Annual Rate (EAR EFF)
- The EAR is the annual rate which causes PV to
grow to the same FV as under multi-period
compounding Example Invest 1 for one year at
12, semiannual - FV PV(1 iNom/m)m
- FV 1 (1.06)2 1.1236.
- EFF 12.36, because 1 invested for one year
at 12 semiannual compounding would grow to the
same value as 1 invested for one year at 12.36
annual compounding.
49
- An investment with monthly payments is different
from one with quarterly payments. Must put on
EFF basis to compare rates of return. Use EFF
only for comparisons. - Banks say interest paid daily. Same as
compounded daily.
50
How do we find EFF for a nominal rate of 12,
compounded semiannually?
(1 )
2
0.12 2
- 1.0
(1.06)2 - 1.0
0.1236 12.36.
51
Finding EFF with HP17BII
- Go to menu starting TVM.
- Select ICNV (for int.rate conversion).
- Select PER (for periodic compounding).
- Enter nominal rate and select NOM.
- Enter number of periods per year and select P.
- Select EFF, which returns effective rate.
52
EAR (or EFF) for a Nominal Rate of of 12
EARAnnual 12. EARQ (1 0.12/4)4 - 1
12.55. EARM (1 0.12/12)12 - 1
12.68. EARD(365) (1 0.12/365)365 - 1
12.75.
53
Can the effective rate ever be equal to the
nominal rate?
- Yes, but only if annual compounding is used,
i.e., if m 1. - If m gt 1, EFF will always be greater than the
nominal rate.
54
When is each rate used?
iNom
Written into contracts, quoted by banks and
brokers. Not used in calculations or shown on
time lines.
55
iPer
Used in calculations, shown on time lines.
If iNom has annual compounding, then iPer
iNom/1 iNom.
56
EAR EFF
Used to compare returns on investments with
different payments per year.
(Used for calculations if and only if dealing
with annuities where payments dont match
interest compounding periods.)
57
Amortization
Construct an amortization schedule for a 1,000,
10 annual rate loan with 3 equal payments.
58
Step 1 Find the required payments.
0
1
2
3
10
PMT
PMT
PMT
-1,000
3 10 -1000
0
INPUTS
N
I/YR
PV
FV
PMT
OUTPUT
402.11
59
Step 2 Find interest charge for Year 1.
INTt Beg balt (i) INT1 1,000(0.10) 100.
Step 3 Find repayment of principal in
Year 1.
Repmt PMT - INT 402.11 - 100
302.11.
60
Step 4 Find ending balance after
Year 1.
End bal Beg bal - Repmt 1,000 - 302.11
697.89.
Repeat these steps for Years 2 and 3 to complete
the amortization table.
61
BEG PRIN END YR BAL PMT INT PMT BAL
1 1,000 402 100 302 698 2 698 402 70 332 36
6 3 366 402 37 366 0 TOT 1,206.34 206.34 1,000
Interest declines. Tax implications.
62
402.11
Interest
302.11
Principal Payments
0
1
2
3
Level payments. Interest declines because
outstanding balance declines. Lender earns 10
on loan outstanding, which is falling.
63
- Amortization tables are widely used--for home
mortgages, auto loans, business loans, retirement
plans, and so on. They are very important! - Financial calculators (and spreadsheets) are
great for setting up amortization tables.
64
On January 1 you deposit 100 in an account that
pays a nominal interest rate of 11.33463, with
daily compounding (365 days). How much will you
have on October 1, or after 9 months (273 days)?
(Days given.)
65
iPer 11.33463/365 0.031054 per day.
0
1
2
273
0.031054
FV?
-100
273
(
)
FV
100
1.00031054
273
(
)
100
1.08846
108.85.
Note in calculator, decimal in equation.
66
iPer iNom/m 11.33463/365 0.031054 per
day.
INPUTS
273 -100 0
108.85
N
I/YR
PV
FV
PMT
OUTPUT
Enter i in one step. Leave data in calculator.
67
Whats the value at the end of Year 3 of the
following CF stream if the quoted interest rate
is 10, compounded semiannually?
4
5
0
1
2
3
6 6-mos. periods
5
100
100
100
68
- Payments occur annually, but compounding occurs
each 6 months. - So we cant use normal annuity valuation
techniques.
69
1st Method Compound Each CF
0
1
2
3
4
5
6
5
100
100.00
100
110.25
121.55
331.80
FVA3 100(1.05)4 100(1.05)2 100
331.80.
70
Could you find the FV with afinancial calculator?
2nd Method Treat as an Annuity
Yes, by following these steps a. Find the EAR
for the quoted rate
EAR (1 ) - 1 10.25.
2
0.10 2
71
b. Use EAR 10.25 as the annual rate in your
calculator
INPUTS
3 10.25 0 -100
N
I/YR
PV
FV
PMT
OUTPUT
331.80
72
Whats the PV of this stream?
0
1
2
3
5
100
100
100
90.70 82.27 74.62 247.59
73
You are offered a note which pays 1,000 in 15
months (or 456 days) for 850. You have 850 in
a bank which pays a 6.76649 nominal rate, with
365 daily compounding, which is a daily rate of
0.018538 and an EAR of 7.0. You plan to leave
the money in the bank if you dont buy the note.
The note is riskless. Should you buy it?
74
iPer 0.018538 per day.
0
365
456 days
1,000
-850
3 Ways to Solve 1. Greatest future wealth
FV 2. Greatest wealth today PV 3. Highest
rate of return Highest EFF
75
1. Greatest Future Wealth
Find FV of 850 left in bank for 15 months and
compare with notes FV 1,000.
FVBank 850(1.00018538)456 924.97 in bank.
Buy the note 1,000 gt 924.97.
76
Calculator Solution to FV
iPer iNom/m 6.76649/365 0.018538 per
day.
INPUTS
456 -850 0
924.97
N
I/YR
PV
FV
PMT
OUTPUT
Enter iPer in one step.
77
2. Greatest Present Wealth
Find PV of note, and compare with its 850 cost
PV 1,000/(1.00018538)456 918.95.
78
6.76649/365
INPUTS
456 .018538 0
1000
-918.95
N
I/YR
PV
FV
PMT
OUTPUT
PV of note is greater than its 850 cost, so buy
the note. Raises your wealth.
79
3. Rate of Return
Find the EFF on note and compare with 7.0 bank
pays, which is your opportunity cost of capital
FVn PV(1 i)n
1,000 850(1 i)456
Now we must solve for i.
80
456 -850 0 1000
0.035646 per day
INPUTS
N
I/YR
PV
FV
PMT
OUTPUT
Convert to decimal
Decimal 0.035646/100 0.00035646.
EAR EFF (1.00035646)365 - 1
13.89.
81
Using interest conversion P/YR 365 NOM 0
.035646(365) 13.01 EFF 13.89 Since 13.89
gt 7.0 opportunity cost, buy the note.
82
OVERVIEW AND THE COST OF CAPITAL ?????????
Page 17
83
I. OVERVIEW OF FINANCIAL MANAGEMENT
- The value of any investment
- present value of the future cash flows that
it is expected to generate for the investor. - ( ????
- ?????????????? )
84
????? . . .
- Use the existing firm assets in ways that will
maximize the cash flows that can be generated
from them, and which are free to be paid to the
investors ????????????. - Accelerate these free cash flows into nearby time
periods ????????, ????? to the extent it is
feasible to do so, because it is the present
value of the free cash flows that determine
shareholder value.
85
????? . . .
- 3. Balance the cash flow generation potential of
the firm against the risks that must be taken to
achieve it. Investors know that some risk has to
be taken to operate a business. However, they do
not like management to take unwarranted risks.
??????????? - 4. Make capital budgeting decisions that will
enhance the economic value of the firm and its
equity shares. ?????????,?????????
86
- 5. Minimize the firms cost of capital by
designing an optimum capital structure.
?????????, ???????? - 6. Choose an optimal dividend policy ???????
that will properly balance the following
objectives - Fund all worthwhile investment opportunities.
???????????? - Maintain the optimum capital structure.
?????????? - Satisfy shareholder preferences for dividends
versus capital gains ??????.
87
B. AGENCY ISSUES???????
- ?????????????????????????,?????? ?????????,
????????
88
AGENCY ISSUES???????
- Managers may opt to increase their salaries and
perquisites ?????????, ???????????, rather than
increase shareholder dividends. - Managers may engage in empire building by
using corporate cash flow to make acquisitions
that increase the size of the enterprise in order
to enhance their own prestige without
commensurately enhancing earnings. ???????,
???????? -
Page 13
89
- Managers might use corporate funds to contribute
to their favorite charities or political parties
to enhance their own reputations at the expense
of maximizing shareholder wealth. ???????, ????,
????? - Managers might employ various measures to
insulate themselves from investors who are
dissatisfied with their performance by
recommending persons that are friendly to them
for positions on the board of directors, enacting
golden parachutes, and so forth ???????,
???????? ?????? ??(???????, ????????)?
90
C. MANAGEMENT MOTIVATION
- Management Compensation ???????????
???????Executive Stock Options? - Intervention ??????????Institutional Investors
?????????? - Replacement ??????
- Takeover Threats ???????????, ????????????????????
??????
91
AGENCY ISSUES?????????????
- ??? (Managers) ? ?? (Shareholders)? ? ?????
- ??? (Banks, Bondholders)? ?? (Shareholders)? ??
?????
92
THE COST OF CAPITAL?????
- A. THE COST OF A FIRMS CAPITAL COMPONENTS
- Debt ????
- Preferred equity ???
- Retained earnings ??????
- Newly issued common stock????? ?????flotation
costs
93
A. THE COST OF A FIRMS CAPITAL COMPONENTS
- The Cost of Debt ???? Capital
- rafter-tax (1-t)rD
94
Example A firms bonds are rated Baa.
Currently, new Baa bonds are being issued with a
coupon of 7. Assuming a corporate income tax
rate of 35, what is the after-tax cost of debt
capital for the firm?
- Answer
- rafter-tax (1-t)rD (1-0.35)(7) 4.55
- ??????coupon ?Yield to Maturity, ??YTM
95
A. THE COST OF A FIRMS CAPITAL COMPONENTS
- 2. The Cost of Preferred Stock ??? Capital
96
Example What is the cost of the preferred
capital of a firm whose currently outstanding
preferred shares pay a dividend of 4.50 per
share and the preferred shares are trading at 60
per share?
- Answer
- rp DIVp 4.50 7.5
- PPS 60
97
A. THE COST OF A FIRMS CAPITAL COMPONENTS
- 3. The Cost of Retained Earnings ??????(Common
equity) - a. The Capital Asset Pricing Model (CAPM)
Approach ???????? - rCE rF ßCS(rM rF)
98
ExampleThe Acme Corporations common shares
have a beta of 1.2. The stock market has a
long-run expected return of 10 per year. If the
risk-free rate is 4, estimate Acmes cost of
retained earnings.
- Answer
- rCE rF ßCS(rM rF) 4 1.2(10
-4) 11.2
99
A. THE COST OF A FIRMS CAPITAL COMPONENTS
- 3. The Cost of Retained Earnings ??????
- (Common equity)
- b. The Dividend-Yield-Plus-Growth- Rate ( or
Implied Return) Approach
100
Example The Ajax Company currently (??
?????)pays a dividend of 2.00 per share on its
common shares. The long-term dividend growth rate
is expected to be 5 per year. If Ajax common
shares are currently selling at 25 per share,
estimate Ajaxs cost of retained earnings capital.
- Answer
101
A. THE COST OF A FIRMS CAPITAL COMPONENTS
- 3. The Cost of Retained Earnings ??????(Common
equity) - c. The Bond-Yield-Plus-Risk-Premium
Approach
102
Example The XYZ Corporations common shares
should sell at a premium of 4 over its long-term
debt yield to compensate for their risk. If XYZs
long-term debt is selling to yield 6.3, estimate
XYZs cost of internal equity.
- Answer
103
A. THE COST OF A FIRMS CAPITAL COMPONENTS
- 4. Cost of Newly Issued Common Stock ?????
?????flotation costs - (Also Called the Cost of External Equity)
104
Example The XYZ Corporations common shares are
trading at 40. The Company currently is paying a
dividend of 2.50 per share on its common stock.
If it were to sell additional common shares,
its flotation cost ?????? would be 15. If the
Company has a 4 long-term growth rate in
dividends per share, calculate its cost of newly
issued common stock (external equity).
Answer
105
B. DETERMINING A FIRMS OPTIMUM CAPITAL
STRUCTURE
- The optimal capital structure (??????) of a firm
is defined as that mix of capital sources that
will maximize the value of a firm taken as a
whole. - One of the important issues in finance is how a
management should determine what its optimal
capital structure should be. - Once determined, this is target capital structure
that the firm should seek to maintain.
106
C. THE WEIGHTED-AVERAGE COST OF CAPITAL
??????????
- The firms weighed-average cost of capital (WACC)
can be found using the target capital structure
????????? and the component capital costs. - A firms cost of funds is called its
weighted-average cost of capital
107
WACC
- The value of the company is the sum of the market
values ????????????of each component, while the
value of the stock is the market value of the
firms outstanding common stock.
108
ExampleConsider a company with the following
capital structure
- Capital Structure
- Book Value ??? Market Value??
- Debt 100 million 106 million
- Preferred Stock 50 52
- Common Equity 350 842
- Total Invested Capital 500 million 1,000
million
109
Example continuedSome other characteristics of
the company are
- Beta of the common stock.1.07x
- Expected secular growth rate 6.0
- Quality of debt ....Aa
- Quality of preferred shares...A
- Expected Dividend yield on common
-
stock.3.7 - Marginal income tax rate..35.0
110
Example continued The prevailing financial
market conditions are as follows
- Quality Yields on Newly Issued Bonds by Qlty
- Aaa 6.9
- Aa 7.0
- A 7.2
- Baa 7.5
- Quality Yields on Newly Issued Preferred
Stocks by Quality - A 7.5
- B 8.0
- C 8.9
- Risk-free rate 6.5
- Equity risk premium over bonds . 2.7
- Expected return on stock market index 9.5
111
Example continuedWhat is the companys
weighted-average cost of capital ???????????
- Answer
- From these data we can find each of the
component costs and, subsequently, the
weighted-average cost of capital. - The cost of debt is 7.0 on a pretax basis, as
this is the cost of newly issued bonds of equal
quality (Aa rating). - The cost of preferred stock is 7.5, which is
equal to the cost of newly issued preferred
stocks of similar quality.
Continue on next page
112
The cost of common equity capital, which is the
cost of retained earnings, (rCE) can be
calculated in one of three ways
- rCErDrERP7.0 2.79.7
- rCErFbCS(rm-rF) 6.5 1.07(9.5-6.5)
9.7
113
Therefore, the weighted-average cost of capital
?????????? of the firm under these conditions is
114
D. THE MARGINAL COST OF CAPITAL ??????????
- Example A companys capital structure is as
follows - Source Capital Structure Weight Component Cost
- Debt 400 million 50 6
- Equity 400 million 50 12
- WACCexisting 9
- The firm must raise 100 m in new capital and
plans to maintain its current capital structure.
Assume that retained earnings are exhausted as a
source of new capital.
115
- gtThus, new debt in the amount of 50 m will be
issued at an after-tax cost of 6 and the other
50 m will come from newly issued common equity.
Because of floatation costs, new common shares
have a cost of 14 instead of the 12 cost of
retained earnings. Under these conditions, - what will be the firms marginal cost of this
100 million unit of capital? ????100Mil
????????
116
- Answer
- The firms marginal cost of this last 100
million unit of capital is 10, which is
calculated as follows - Source Capital Struc. Weight Component
W.
Cost Cost - Debt 50 million 50 6 0.5(6) 3
- Equity 50 million 50 14 0.5(14) 7
-
10
117
E. FACTORS AFFECTING THE COST OF CAPITAL
- Factors That the Firm Can Control
- Capital Structure ????????????????
- Dividend Policy ????????????,???????
- Investment Policy ??????????????
118
THE BASICS OF CAPITAL BUDGETING
119
I. INTRODUCTION
- Capital budgeting is the process of
analyzing projects in order to decide which ones
should be undertaken.
120
II. RANKING CAPITAL PROJECTS
- A. FOUR METHODS AND THEIR CALCULATION
- Payback Period
- Discounted Payback Period
- Net Present Value (NPV)
- Internal Rate of Return (IRR)
121
3. Net Present Value (NPV)
- Example
- Calculate the net present value of the above
project whose cost of capital is 10. - Answer
- Year Cash Flow P.V. of Cash Flow
- 0 (100,000) (100,000)
- 1 20,000 18,182
- 2 40,000 33,058
- 3 60,000 45,079
- 4 30,000 20,490
- 5 10,000 6,209
- 23,018
122
3. Net Present Value (NPV)
- A project whose net present value is equal to or
greater than zero is one that is expected to
produce a rate of return that is equal to or
greater than the cost of capital required to
justify it. Such a project should be undertaken.
A project with a negative net present value is
one that is expected to produce a rate of return
less than the cost of capital required to justify
it. Such a project should be rejected.
123
4. Internal Rate of Return (IRR)
- Example
- What is the internal rate of return for the
project in the previous problem?
124
4. Internal Rate of Return (IRR)
- Answer
- An internal rate of return requires a trial and
error solution. However, using the cash flow
functions of a financial calculator, the internal
rate of return can be quickly determined. This is
shown using the following cash flows - Year Cash Flow
- 0 (100,000)
- 1 20,000
- 2 40,000
- 3 60,000
- 4 30,000
- 5 10,000
125
4. Internal Rate of Return (IRR)
- Answer continued
- HP12C TIBA2
- 1000?CHS??g??CF0? ?CF?1000 ?/-??ENTER????
- 200 ?g??CFj? 200 ?ENTER????
- 400 ?g??CFj? 400 ?ENTER????
- 600 ?g??CFj? 600 ?ENTER????
- 300 ?g??CFj? 300 ?ENTER????
- 100 ?g??CFj??f??IRR? 100 ?ENTER??IRR??CPT?
- The answer is 18.91
126
a. Modified Internal Rate of Return (MIRR)
127
B. INTERPRETING THE VARIOUS METHODS OF RANKING
PROJECT RETURNS
- Payback Period
- Discounted Payback Period
- Net Present Value (NPV)
- The net present value method is generally
regarded as the best method for ranking
investment projects
128
3. Net Present Value (NPV)
- Example
- Three projects, each with a cost of 15, have
the following free cash flows - Year Project A Project B Project C
- 0 (50,000) (120,000) (20,000)
- 1 40,000 (50,000) 2,000
- 2 20,000 150,000 15,000
- 10,000 75,000 15,000
- If the projects are independent, which one(s)
should be undertaken? - If the projects are mutually exclusive, which one
should be undertaken?
129
Answer
- 1. The NPVS of the projects are
- Yr NPV of Proj A NPV of Proj B NPV of
Proj C - _at_15 _at_15 _at_15
- 0 (50,000) (120,000) (20,000)
- 1 34,783 (43,478) 1,739
- 2 15,123 113,422 11,342
- 3 6,575 49,314 9,863
- 6,481 (742) 2,944
- If the projects are independent, undertake
Project A and C because both have positive NPVS. - 2. If the projects are mutually exclusive,
undertake Project A because it has the highest
NPV.
130
4. Internal Rate of Return (IRR)
- If two projects are independent of each other,
then the internal rate of return methodology will
produce the same decision with regard to
undertaking projects as the net present value
method - if projects are mutually exclusive, the internal
rate of return may produce a different ranking
than the net present value method when both the
internal rate of return and the net present value
methods produce accept decisions, the order of
the rankings among alternative projects produced
by the two methods can differ.
131
- When one project is more expensive than another
(the sizes of the two investments differ). - When the timing of the cash flows differ such
that most of the cash flows come in the early
years for one project, while most of the cash
flows come in the later years for the other
project.
132
a. Modified Internal Rate of Return (MIRR)
- The MIRR method is better than the IRR method,
but still inferior to the NPV method, for ranking
capital projects.
133
III. POST-AUDIT AND CAPITAL RATIONING
- A. THE POST-AUDIT PROCESS
- Improve forecasts through employees learning
why their original forecasts were missed and the
employees knowing that their actions are being
monitored. - Improve operations through the desire of
employees to meet their forecasts. The
employee(s) will work harder to make sure
operations are improving so that forecasts will
be met. - B. CAPITAL RATIONING
134
CASH FLOW ESTIMATION AND OTHER CAPITAL BUDGETING
TOPICS
135
I. INTRODUCTION
- A. CASH FLOW VS. ACCOUNTING PROFIT
- B. DEFINITIONS
- a. The incremental free cash flow of a project
should be calculated before financing costs,
because the method of financing an assets
purchase has no bearing on the value of the
asset. - b. The cost of capital used as the discount rate
in determining the present value of the net free
cash flows is an after-tax cost (as it is in the
conventional WACC formulation). - . Sunk costs are costs that would be incurred
regardless of whether or not an investment is
made in the asset or project being evaluated. - d. Opportunity costs are cash flows that could
be generated from assets already owned by a firm
if they were not used for the target project. - e. Externalities are the positive or negative
changes in the cash flows of projects (other than
the target project) that are attributable to the
target project. - f. Shipping and installation costs associated
with a target project should be included as part
of its incremental net free cash flows to be
analyzed.
136
- Therefore, the weighted-average cost of capital
of a firm is the proper discount rate at which to
discount the future projected net free cash flows
it is expected to generate. This implicitly
assumes that the target projects risk is about
the same as the average risk inherent in a firms
normal business activities. - Since the weighted-average cost of capital is
used as the discount rate, the incremental
unleveraged free cash flow of the project should
be the variable that is discounted in calculating
its net present value (NPV).
137
II. PROJECT ANALYSIS A. ANALYSIS OF AN
EXPANSION PROJECT
- Example
- A company is attempting to decide whether or not
to enter the widget business over the next 5
year. It estimates that it could generate widget
sales of 600,000 and earn a net income of
88,980 per year over a 5-year period beginning
next year. - However, to enter the widget business, an
initial investment outlay of 512,000 will be
required, of which 510,000 is for a
widget-making machine and 2,000 is for working
capital . The widget-making machine has a useful
life of 5 years and a salvage value of 10,000.
Management intends to depreciate it over its
useful life using the straight-line method for
both book and tax purposes. The purchase of the
machine will be financed entirely with 7 debt. - Management uses the accrual method of accounting
for both book and tax purposes. The following pro
forma data depicts managements estimates of the
annual incremental revenues, expenses, and
working capital outlays associated with the
widget business in each of the next 5 years of
operation
138
Example continuedIncremental Annual Effects of
the Widget Project
- Sales 600,000
- Direct Expenses 300,000
- Depreciation 100,000
- Selling Expenses and Externalities
16,000 - Administrative Expenses
0 (1) - EBIT 184,000
- Interest Expense 35,700
- Pretax Income 148,300
- Income Tax Expense _at_40 59,320
- Net Income 88,980
- Required Additional
- Working Capital Outlay
40,000 (2)
139
Example continued
- (1) Administrative expenses are sunk costs
because they would be incurred whether or not the
widget project is undertaken. Thus they add no
incremental cost to the widget project. - (2) The additional working capital requirements
of the widget project must be included in the
analysis because capital budgeting decisions are
based on an incremental cash flow analysis, and
not a net income analysis. The net increase in
working capital required by the widget project is
necessary because it will be used as a negative
adjustment to pro forma net income to bring it
down to cash flow.
140
Example continued
- In addition, it is assumed that a terminal-year
cash flow will be produced in the sixth year
consisting of 10,000 for selling the
widget-making machine for its salvage value,
2,000 of closing expenses, and the collection of
40,000 from outstanding receivables and the sale
of unsold inventory at cost.
141
Example continued The capital structure of
the Company is as follows
- Capital Structure
- Book Value Market Value
- Negotiated Debt 10,000,000 11,000,000
- Preferred Stock 5,000,000 6,000,000
- Common Equity 70,000,000 83,000,000
- Total Invested Capital 85,000,000
100,000,000
142
Example continued
- Current conditions in the financial markets
suggest that yields on newly issued bonds and
preferred stocks whose risks and other
characteristics are the same as those of the
Company are as follows - Bond Yields..7.0
- Preferred Stock Yields.6.0
- The Companys common shares are currently paying
a 3.00 dividend per share and are trading on the
stock exchange at 30 per share. The Company is
mature, with an expected long-term dividend
growth rate of 6 per year.
143
Example continued Given this inform and
assuming the widget business is similar in terms
of risk to the Companys other product lines,
answer the following questions
- Calculating the initial investment outlay for the
widget project. - Calculate the incremental cash flows of the
project for the operating years (Years 1-5). - Calculate the terminal-year cash flow (Year 6).
- Calculate the weighted average cost of capital of
the firm. - Determine whether or not the widget project
should be undertaken.
144
Answer
- 1. Calculating the initial investment outlay
(Year 0) - Cost of the Widget-making Machine
510,000 - Additional Working Capital
2,000 - Initial Investment Outlay 512,000
145
2. Calculating the incremental cash flows during
the operating years (Years 1-5)
- The table below shows how the pro forma income
and additional working capital information is
used to determine the incremental cash flows
during the operating years - Projected Projected
- Pro Forma (Free) Cash
- Income Flows
- Sales 600,000 600,000
- Direct Expenses 300,000 300,000
- Depreciation 100,000 100,000
- Selling Expenses and Externalities 16,000
16,000 - EBIT 184,000
184,000 - Interest Expense 35,700
- Pretax Income 148,300
- Income Tax Expense _at_40 59,320
73,600(40 of EBIT) - Net Income 88,980
- EBIT(1-t) 110,400
- Plus Depreciation 100,000
- Less Capital Expenditures 0
- Less Required Additional
- Working Capital Outlay 40,000
146
Notice that the calculation of the incremental
cash flow accruing to the firm from the normal
operation of the widget project is really the
(unrevealed) free cash flow to the firm, defined
as
- FCFF EBIT(1-t) DEPR CAPX ?WC
147
In performing this calculation, remember
- 1. Interest expense is not counted as a cost in
calculating this free cash flow to the firm from
the operation of the widget business, even though
it is counted as a cost in calculating the
projects net income. This is because the cost of
debt capital is included in the firms weighted
average cost of capital that will be used to
discount these cash flows to their present value.
To include the effects of leverage in both the
cash flow calculation and the discount rate used
to reduce it to NPV would count the effect of
leverage twice.
148
In performing this calculation, remember
- The income tax expense is not the same when
calculating the free cash flow to the firm as the
actual income tax expense used to calculate net
income. In the free cash flow to the firm
calculation, the income tax expense is computed
by multiplying the income tax rate by EBIT,
whereas the actual income tax expense used to
determine net income is computed by multiplying
the income tax rate by pretax income. The
difference in the two calculations is the
interest tax shield that is produced by financial
leverage - Difference in Income Tax Calculation
73,600 59,320 14,280 - Interest Tax Shield t(INT)
0.40(35,700) 14,280
149
- In effect, the free cash flow to the firm
calculation excludes the impact of the interest
tax shield on a firms cash flow. This is
appropriated because all of the effects of
financial leverage are taken into account when
the firms weighted average cost of capital is
used to discount these projected cash flows to
their present value. To include the interest tax
shield effects of financial leverage in both the
cash flow calculation and the discount rate used
to reduce it to present value would count the
effect of leverage twice. - The required additional working capital is
counted as a cash outflow when computing the free
cash flow to the firm, while it is not counted as
an expense in computing net income.
150
3. Calculating the terminal-year cash flow (Year
6)
- The cash flow accruing to the firm in the
terminal year is as follows - Cash Flow
- Pretax After-Tax
- Cash from Sale of Machine 10,000
10,000--(1) - Plus Cash from Collection of
- Receivables and sale of
- unsold inventory 40,000
40,000(2) - Less Closing expenses, net
- of taxes 2,000 1,200(3)
- Terminal-year cash flow 48,000
48,000
151
- (1) The machine is sold for its book value.
Therefore, no tax is owed or saved on the
transaction. - (2) The Company uses accrual accounting for
book and tax purposes. Therefore, no tax is due
when receivables are collected, because it was
paid in prior years when the income on sales were
reported Inventories were sold at cost, so no
taxes are owed or saved at this time. - (3) Closing expense are tax deductible.
Therefore, there is a tax savings of 800 that
(presumably) can be used to reduce the Companys
over all tax burden for the year. Thus, the net
closing expenses after this tax saving is - Net Closing Expense 2,000(1-0.4) 1,200
152
4. Calculating the firms weighted average cost
of capital
- To calculate the firms weighted average cost of
capital, first compute the firms cost of common
equity - rCE DIV1/PCS gDIV 3(1.06)/30 0.06
16.6 - The weighted-average cost of capital of the firm
is, therefore - rw (1-t)rD (VD/ VA) rP (VP/ VA) rCE (VCE/
VA) - rW (1-0.4)(0.07)(11,000,000/100,000,000)
0.06(6,000,000/100,000,000) 0.166(83,000,000/100
,000,000) 14.6
153
5. Making the capital budgeting decision
- The best way to make the capital budgeting
decision is to compute the net present value
(NPV) of all of the cash flows to the firm (the
initial cash outlay, the cash generated from the
project over its operating years, and the
terminal-year cash flow), using the firms
weighted average cost of capital as the discount
rate. If the NPV is positive, the project should
be undertaken if it is negative, it should not
be undertaken.
154
Note
- The cost of capital for the project is the
weighted average cost of capital of the firm
because this project has approximately the same
risk that is inherent in the firms overall
business. While the widget machine was financed
entirely with 7 debt capital, this is not the
cost of capital for the project because,
ultimately, the firms capital structure must be
rebalanced back to its target proportions of
debt, preferred stock, and common equity.
155
The table below depicts the projected cash flows
over the life of the widget project and the NPV
of the project when these cash flows are
discounted to their present value using the
firms WACC
- Year Cash Flow PV of Cash Flow _at_14.6
- 0 (512,000) (512,000)
- 1 170,400 148,691
- 2 170,400 129,748
- 3 170,400 113,218
- 4 170,400 98,794
- 5 170,400 86,208
- 6 48,800 21,543
- 86,202
- Since the NPV of the free cash flows to the firm
generated by the project is positive, the
expected return on the project is greater than
the firms cost of capital. Therefore, the widget
project should be undertaken.
156
B. ANALYZING A REPLACEMENT PROJECT
- Example
- A company is thinking of replacing a machine and
buying a new one. - The annual cash operating expenses associated
with the current machine are 100,000. - the machine is being depreciated by 10,000 per
year (straight line). It has a useful life of
five additional years and, if sold today, it
could fetch 5,000 in the used machine market,
which is 2,000 below its book value. - The new machine would probably be used for 5
years, at which time it would be fully
depreciated. However, it could be sold for 7,000
at the end of Year 5(which is an estimate and not
a salvage value for purposes of computing
depreciation from a tax perspective). - The cash operating expenses required to operate
the new machine are only 60,000 per year, but it
would also require an additional working capital
each year of 3,000. The price of the new machine
is 90,000. The firms cost of capital is 15 and
its marginal income tax rate is 40.
157
Example continued
- Calculate the initial investment outlay for the
analysis - The initial investment outlay in Year 0 is the
cost of the new machine, less the cash received
from selling the old machine and the tax savings
that accrues to the benefit of the Company
because it sells the old machine at a loss - Cash Outlay
- Cost of New Machine 90,000
- Less Sale of Old Machine 5,000
- Less Tax Savings on Sale of Old
- Machine 800?0.402,000
loss? - Initial Investment Outlay 84,200
158
Example continued
- Calculate the operating cash flows for the
normal years(1-4) - The table below summarizes the calculation of
the regular operating cash flows from this
replacement project - Cash Flow
- After-tax reduction in cash operating
costs 24,000 (1) - Depreciation on new machine 18,000
- Depreciation on old machine
10,000 - Increase in depreciation 8,000
- Tax savings on increase in depreciation
3,200 (2) - Less Increase in required working capital
3,000 - Operating cash flow 24,200
- (1) (1-t)(100,000 60,000) (0.60)(40,000)
24,000 - (2) Tax Savings t (Increase in depreciation)
0.40(8,000) 3,200
159
Example continued
- 3. Calculate the terminal-year cash flow (Year
5) - The cash flows in the terminal year are the
regular operating cash flow of 24,200 associated
with the project and the special cash flows that
occur in Year 5 as summarized in the table below -
Cash Flow - Regular operating cash flow 24,200
- Proceeds from sale of machine 7,000
- Less Tax on gain from sale of machine
2,800 (3) - Terminal-year cash flow 28,400
- (3) Tax on gain from sale t (Gain on sale)
0.40(7,000) 2,800
160
Example continued
- 4. Construct a cash flow table for the life of
the new machine. - This table should depict the cash flows
resulting from the replacement project from Year
0 through Year 5, and calculate the net present
value (NPV) of those cash flows. - The cash flow for this replacement project
and the NPV calculation is contained in the
following table - Year Cash Flow PV of Cash Flow _at_15
- 0 (84,200) (84,200)
- 1 24,200 21,299
- 2 24,200 18,299
- 3 24,200 15,912
- 4 24,200 13,836
- 5 24,200 14,020
- NPV (1,090)
- Answer
- The old machine should not be replaced because
the NPV of the project is negative.
161
III. OTHER CAPITAL BUDGETING TOPICS
- A. MAKING DECISIONS REGARDING PROJECTS WITH
DIFFERENT USEFUL LIVES - The methods described previously for ranking
projects are applicable only if the projects all
have the same time horizon.
162
Example
- The management of the Gadget Manufacturing
Company must decide which of two machines to buy
in order to make one of the components of the
gadget that they manufacture more cheaply. - Machine A costs 600,000 to buy and would save
the Company 300,000 of operating costs per year.
Its useful life is three years. - Machine B costs 700,000 to buy and would save
the company 200,000 per year to operate and has
a useful life of six years. - Both machines can produce the same output and
make the same contribution to revenues every
year. One or the other machine will be bought it
is only a matter of which is the cheapest to
operate, all factors considered. - The company has a weighted average cost of
capital of 14. Both machines have zero salvage
value. - Which machine should purchased?
163
answer 1. The Equivalent Annuity (EAA) Approach
- The equivalent annual annuity is defined as the
size of the annuity payment required each year of
an assets life to make the present value of the
operating cash flows equal the NPV of the asset,
using the cost of capital for the asset as the
discount rate. The asset with the algebraically
highest EAA is considered to be the best
investment.
164
answer 1. The Equivalent Annuity (EAA) Approach
- Applied to this problem, the EAAs for the two
machines are calculated as follows, using a
financial calculator. The annual operating cash
flows generated by Machine A and Machine B and
their respective present values are - Year Machine A P.V. of A
Machine B P.V of B Operating
Operating
Operating Operating - Cash Flows CF _at_14
CF CF _at_14 - 0 (600,000) (600,000)
(700,000) (700,000) - 1 300,000 263,158 200,000
175,439 - 2 300,000 230,840 200,000
153,894 - 3 300,000 202,491 200,000
134,994 - 4 200,000 118,416
- 5 200,000 103,874
- 6 200,000 91,117
- 96,489 77,734
165
- Machine A Machine B
- PV 96,489 PV 77,734
- n 3 n 6
- i 14 i 14
- FV 0 FV 0
- EAA PMT 41,561 EAA PMT 19,990
- The decision is to buy Machine A because it has
the algebraically higher equivalent annual
annuity per year.
166
- ?????? I
- In Class Question
- P57
167
Other Capital Budgeting Topics MAKING DECISIONS
REGARDING PROJECTS WITH DIFFERENT USEFUL LIVES
- For the projects with different time horizon
- (A??NPV ??, ????????10?
- B??NPV ?????, ?????5? ) . . .
168
??
- The management of the Gadget Manufacturing
Company must decide which of two machines to buy
in order to make one of the components of the
gadget that they manufacture more cheaply. - Machine A costs 600,000 to buy would save the
Company 300,000 of operating costs per year. Its
useful life is three years. - Machine B costs 700,000 to buy would save the
company 200,000 per year to operate has a
useful life of six years.
169
??
- The management of the Gadget Manufacturing
Company must decide which of two machines to buy
in order to make one of the components of the
gadget that they manufacture more cheaply. - Machine A costs 600,000 to buy would save the
Company 300,000 of operating costs per year. Its
useful life is three years. - Machine B costs 700,000 to buy would save the
company 200,000 per year to operate has a
useful life of six years.
170
?? ?
- Both machines can produce the same output make
the same contribution to revenues every year. One
or the other machine will be bought it is only a
matter of which is the cheapest to operate, all
factors considered. - The company has a weighted average cost of
capital of 14. Both machines have zero salvage
value. - Which machine should purchased?
171
2. The Replacement Chain (Common Life) Approach
- The replacement chain (Common Life) method solves
the problem by equalizing the lives of the two
machines. - This is done by extending the life of Machine A
until it equals that of Machine B by treating the
problem as if Machine A ???? ? at the end of Year
3, ?? Machine A . . . ? - In that case, the operating cash flows of the two
machines their associated present values would
appear as follows
172
2. The Replacement Chain (Common Life) Approach
_at_ 14 continued
- Year Machine A P.V. of Machine B
P.V of - Operating Machine A Operating Machine
B - Cash Flows Operating Cash Flows
Cash Flows - 0 (600,000) (600,000) (700,000) (700,000)
- 1 300,000 263,158 200,000 175,439
- 2 300,000 230,840 200,000 153,894
- 3 (300,000)() (202,491) 200,000
134,994 - 4 300,000 177,624 200,000 118,416
- 5 300,000 155,811 200,000 103,874
- 6 300,000 136,767 200,000 91,117
- 161,618 77,734
173
- () ??? If a new Machine A is purchased at the
end of the third year, the cash flows in that
year will be - 300,000-600,000 (300,000)
- This approach leads to the decision to buy
Machine A, because it has the higher net present
value of its cash flows.
174
Other Capital Budgeting Topics THE EFFECT OF
INFLATION ON NPV ANALYSIS
- Cost of Capital r ???? EXPECTED INFLATION, ??
Incremental Cash Flow ?????????????
175
CAPITAL BUDGETING RISK ANALYSIS
- I. TYPES OF RISK
- Stand-alone Risk
- Corporate (Within-firm) Risk
- Market Risk (Beta)
176
?? Which of the following statements is true?
- Stand-alone risk is the best way for a
congl
Recommended
CrystalGraphics Presentations


