
Ingen diastitel - PowerPoint PPT Presentation
Title: Ingen diastitel
1
Urea concentration affects short-term N turnover
and N2O production in grassland soil Søren O.
Petersen1, S. Stamatiadis2, C. Christofides2, S.
Yamulki3 and R. Bol3 1Danish Institute of
Agricultural Sciences, Dept. of Agroecology,
Tjele, DK 2GAIA Centre, Ecology Biotechnology
Laboratory, Kifissia, GR 3Institute of Grassland
and Environmental Research, Soils Agroecology
Dept., North Wyke, UK
Background For Western Europe it is estimated
that, on average, 8 of total N excreted by dairy
cattle is deposited during grazing (IPCC, 1997).
The intake and excretion of N is influenced by
factors such as feed composition, lactation stage
and pasture quality, and the excretion of excess
N as urea in the urine can therefore vary
considerably. It is well-known that plant
roots may be scorched by urine deposition due to
high levels of ammonia in the soil following urea
hydrolysis. We hypothesized that ammonia could
also be a stress factor for soil organisms,
including nytrifying and denitrifying bacteria,
and hence influence N2O emissions. This
laboratory study was conducted to investigate
short-term effects of urea concentration on N2O
emissions and mechanisms behind.
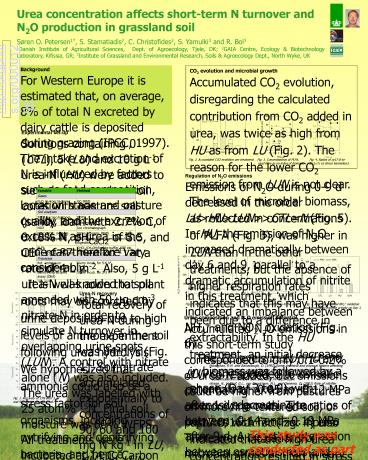
CO2 evolution and microbial growth Accumulated
CO2 evolution, disregarding the calculated
contribution from CO2 added in urea, was twice as
high from HU as from LU (Fig. 2). The reason for
the lower CO2 emission from LUN is not clear. The
level of microbial biomass, as reflected in
concentrations of PLFA (Fig. 3), was higher in
LUN than in the other treatments, but the absence
of higher respiration rates indicates that this
may have been due to a difference in
extractability. In the HU treatment, an initial
decrease in biomass was followed by a phase (Day
3 to 9) with extensive growth. The ratios of
cy170/161w7c (Fig. 4) also indicated that the
high urea concentration resulted in stress
followed by rapid microbial turnover.
Archived at http//orgprints.org/00001296
Experimental set-up Solutions containing 0 (CTL),
5 (LU) and 10 g L-1 urea-N (HU) were added to
sieved and repacked soil cores with pasture soil
(sandy loam with 2.7 C, 0.18 N, pHCaCl2 of 5.5,
and CEC of 87 meq kg-1) at a rate of 4 L m-2.
Also, 5 g L-1 urea-N was added to soil amended
with 50 µg cm-3 nitrate-N in order to simulate N
turnover in overlapping urine spots (LUN). A
control with nitrate alone (N) was also included.
The urea was labelled with 25 atom 15N. Final
soil moisture was 60 WFPS. All treatments were
incubated at 14?C. Carbon dioxide and N2O
evolution rates were determined after c. 0.2,
0.5, 1, 3, 6 and 9 d. At the four last samplings,
the replicates used for gas flux measurements
were then destructively sampled for determination
of the variables listed below.
Fig. 2. Accumlated CO2 evolution per treatment.
Fig. 3. Concentrations of PLFA, Fig. 4.
Ratios of cy170-to-
used
here as an index of biomass. 161w7c (a
stress biomarker).
Regulation of N2O emissions Emissions of N2O
during 0-9 d decreased in the order
LUgtHUgtLUNgtgtCTLN (Fig. 5). In HU, the emission of
N2O increased dramatically between day 6 and 9,
parallel to a dramatic accumulation of nitrite in
this treatment, which indicated an imbalance
between NH4 and NO2- oxidation (Fig. 6). The
EC levels in LU, HU and LUN corresponded to
osmotic potentials of -0.05 to -0.12 MPa after 1
d, decreasing to between -0.14 and -0.19 MPa
after 9 d. A negative interaction between osmotic
stress and high NH4 concentrations has been
observed, particularly for nitrite oxidation
(Harada and Kai, 1968). The level of NH3(aq)
calculated for the HU treatment suggested that
nitrification rates could be significantly
reduced (Monaghan and Barraclough, 1992), as was
also observed in this study (cf Fig. 1). The
potential for ammonium oxidation (PAO) was not,
however, reduced in HU compared to the other urea
treatments (Fig. 7), indicating that the
inhibition of NH4 oxidation in the soil was
reversible. Denitrifying enzyme activity (DEA)
was clearly affected by the urea amendment,
probably as a result of the change in pH (Simek
et al., 2002). The time course of N2O
emissions, and the correspondence with nitrite
accumulation in HU indicates that ammonium
oxidation was the main source of N2O in the
system investigated. The N dynamics observed were
consistent with nitrifier-denitrification (Wrage
et al., 2001).
Urea-N recovery Total recovery of urea-N during
the experiment was 84?1 (Fig. 1). Soil nitrate
accumulated exponentially to concentrations of
90, 60 and 100 mg N kg-1 in LU, HU and LUN after
9 d. Of this, 47, 40 and 58 mg N kg-1 was derived
from urea. Nitrification was thus delayed in the
HU treatment. Between 33 and 52 of the
nitrate produced was derived from soil N,
although initial soil NH4 was lt5 mg N kg-1. This
suggests a significant initial turnover of the
NH4 pool. Total concentrations of NH4 after 1 d
corresponded to 51-61 of urea-N added, and after
3 d to 80-85. The transient disappearance could
be due to microbial assimilation in response to
the sudden decrease in osmotic potential.
Urine composition and N2O emission
potential Accumulated N2O emisssions in this
short-term study corresponded to only 0.1-0.2 of
urea-N added, but emissions could be higher from
pastures on more fine-textured soil, or pastures
with fertilizer inputs. There were indications of
microbial stress at high urinary urea
concentration, and evidence for at interaction
with N2O emissions. Management practices which
reduce the level of surplus N excreted during
grazing may reduce the potential for N2O
emissions induced by microbial stress.
References Harada, T. and Kai, H. (1968) Studies
on the environmental conditions controlling
nitrification in soil. Soil Sci. Plant Nutr. 14
20-26. Monaghan, R.M. and Barraclough, D. (1992)
Some chemical and physical factors affecting the
rate and dynamics of nitrification in
urine-affected soil. Plant Soil 143
11-18. Simek, M., Jisova, L. and Hopkins, D.W.
(2002) What is the so-called optimum pH for
denitrification in soil? Soil Biol. Biochem. 34
1227-1234. Wrage, N., Velthof, G.L., van
Beusichem, M.L. and Oenema, O. (2001) Role of
nitrifier denitrification in the production of
nitrous oxide. Soil Biol. Biochem. 33 1723-1732.
Fig. 1. Recovery of 15N after 3, 6 and 9 d in
urea-amended soil.
This study was conducted as part of the FP5
project Greenhouse Gas Mitigation for Organic
and Conventional Dairy Production (MIDAIR). It
also contributes to the Danish project
Dinitrogen Fixation and Nitrous Oxide Losses in
Organically Farmed Grass-Clover Pastures An
Integrated Experimental and Modelling Approach.
Recommended
CrystalGraphics Presentations


