
A - PowerPoint PPT Presentation
1 / 1
Title: A
1
Prediction Skill of the NAO and PNA from Daily to
Seasonal Time-scales Åke Johansson
SAIC/Environmental Modeling Center National
Centers for Environmental Prediction,
NWS/NOAA/DOC On leave from the Swedish
Meteorological and Hydrological Institute (SMHI),
SE-601 76 Norrköping, Sweden
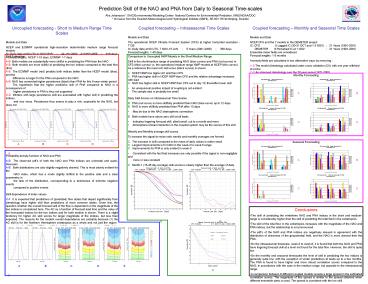
Coupled forecasting Monthly and Seasonal Time
Scales Models and Data NCEP CFS and the 7 models
in the DEMETER project IC CFS
5 Lagged IC (30-31 OCT and 1-3 NOV) 21
Years (1981-2001) DEMETER 9
Perturbed IC at 1 NOV
21 Years (1981-2001) Ensemble mean fields are
considered Forecast lengths 1-5 months Anomaly
fields are calculated in two alternative ways by
removing A-B The model climatology calculated
under cross validation (CV) with one year
withheld at a time C-D An observed climatology
over the 30 year period 1971-2000
Uncoupled forecasting - Short to Medium Range
Time Scales Models and Data NCEP and ECMWF
operational high-resolution deterministic medium
range forecast models IC Daily data at 00 UTC in
NOV-MAR 22 JAN 2000 24 MAR 2005
819 days Forecast lengths NCEP 1-15 days,
ECMWF 1-7 days
Coupled forecasting Intraseasonal Time
Scales Models and Data The operational NCEP
Climate Forecast System (CFS) at higher
horizontal resolution - T126 IC Daily data at 00
UTC, 7 NOV-15 JAN 5 Years (2001-2005)
350 days Forecast lengths 1-45 days
Skill Evaluation A-B Both models are
substantially more skillful in predicting the PNA
than the NAO A-B Both models are more skillful
at predicting the two indices compared to the
total flow (thin) A-B The ECMWF model (red)
predicts both indices better than the NCEP model
(blue), and the difference is larger for
the PNA compared to the NAO A-B NAO has somewhat
higher persistence (black) than PNA for this
5-year winter period The hypothesis that
the higher predictive skill of PNA compared to
NAO is a consequence of higher
persistence in PNA is thus not supported C-D
Winters with large persistence skill are
associated with higher skill in predicting the
indices, and vice versa. Persistence
thus seems to play a role, especially for the
NAO, but does not explain superior
skill for PNA E An interesting feature is
the occurrence of a secondary maximum of the NAO
persistence in many winters. No evidence
of similar behavior is noted for the PNA. Ambaum
and Hoskins argue that this feature may
be a consequence of troposphere-stratosphere
interaction in the NAO region. However,
for the overall AC skill it is hard to see any
impact
- Comparison to Uncoupled NWP Models in the
Short/Medium Range - Skill in the short/medium range of predicting NAO
(blue curves) and PNA (red curves) in CFS (thick
curves) vs. the operational medium range NWP
models at NCEP (thin curves). As a reference the
mean AC skill score (black curves) is shown. - A NCEP NWP has higher AC skill than CFS
- A PNA has higher skill in NCEP NWP than CFS and
the relative advantage increases with lead - A NAO has higher skill in NCEP NWP than CFS out
to day 10, thereafter lower skill - An unequivocal positive impact of coupling is
not evident - The sample size is probably too small
- Daily Skill Scores on Intraseasonal Time Scales
- B PNA (red curve) is more skillfully predicted
than NAO (blue curve) up to 12 days - B NAO is more skillfully predicted than PNA
after 13 days - May be due to the NAO stratospheric
connection - B Both models have above zero skill at all
leads - Indicates lingering forecast skill, albeit
small, out to a month and more - Atmosphere-Ocean interaction in the coupled
system may be the source of this skill - Weekly and Monthly average skill scores
- To increase the signal-to-noise ratio weekly and
monthly averages are formed - C The increase in skill compared to the mean of
daily values is rather small
Monthly Forecasting
A
B
C
D
Seasonal Forecasting
A B
C
D E
Probability density function of NAO and PNA A-B
The observed pdfs of both the NAO and PNA
indices are unimodal and quasi-Gaussian A-B
Both distributions are also slightly negatively
skewed. This is most clearly evident for the
NAO index, which has a mode slightly shifted
to the positive side and a clear asymmetry in
the tails of the distribution,
corresponding to a dominance of extreme negative
events compared to positive
events. Skill dependence of index values C-F It
is expected that predictions of (predicted) flow
states that depart significantly from climatology
have higher skill than predictions of more common
states. Given this, the question whether the
overall forecast skill of the flow is dependent
on the magnitude of the two indices is considered
here. The AC as a function of forecast lead time
and the value of the forecasted indices for the
two indices and for both models is shown. There
is a slight tendency for higher AC skill scores
for larger magnitude of the indices, but less
than expected. The reasons for the modest overall
dependence are probably because (1) the AC skill
is for the Northern Hemisphere extratropics as a
whole and not just the regions occupied by the
NAO and PNA and (2) the NAO and PNA each only
explain 10 of the variance of daily flows in
the Northern Hemisphere extratropics. If
regionalized skill scores are used instead, they
would probably exhibit a stronger dependence.
Furthermore, since the NAO and PNA are almost
uncorrelated, a larger dependence would probably
result from use of a combined index.
A
B
C
D
- Conclusions
- The skill of predicting the wintertime NAO and
PNA indices in the short and medium-range is
considerably higher than the skill of predicting
the total field in the extratropics. - The skill of the total flow in the extratropics
increases with the magnitude of the NAO and PNA
indices, but the relationship is not pronounced. - The pdfs of the NAO and PNA indices are
negatively skewed in agreement with the
distribution of skewness of the geopotential
field, and the NAO is more skewed then the PNA. - On the intraseasonal timescale, week-3 to week-6,
it is found that both the NAO and PNA have
lingering forecast skill at a level not found for
the total flow. However, the skill is quite low. - On the monthly and seasonal timescales the level
of skill in predicting the two indices is
generally quite low, with the exception of winter
predictions at leads up to a few months. The PNA
is found to have higher and more robust
correlation scores compared to the NAO, in
accordance with the case in the medium range, but
opposite to the intraseasonal range. - A comparison between 8 different coupled models
reveals a large spread in the estimated
correlation scores. The magnitude of this spread
is similar to the spread obtained when different
ensemble sizes is used. The spread is consistent
with the low skill.
A
B
Month-1 Correlation Scores NAO
33.0 PNA 21.3
A B
C
D E
F
C
Recommended
CrystalGraphics Presentations


