
Jamie Milner Vice President, Pipeline Integrity - PowerPoint PPT Presentation
1 / 12
Title:
Jamie Milner Vice President, Pipeline Integrity
Description:
GIS at Enbridge Gas Distribution The Long View ... EGD moved from mylar plates to GE Smallworld. 2006 GIS integrated with PMTS (EGDs Asset Management Repository. – PowerPoint PPT presentation
Number of Views:96
Avg rating:3.0/5.0
Title: Jamie Milner Vice President, Pipeline Integrity
1
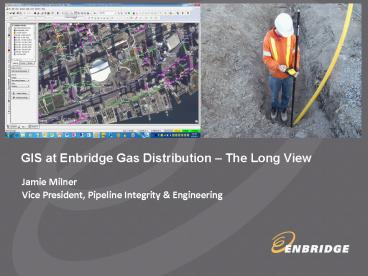
Jamie MilnerVice President, Pipeline Integrity
Engineering
GIS at Enbridge Gas Distribution The Long View
2
About Enbridge Gas Distribution
- Canada's largest natural gas distribution company
- Based in Toronto, Ontario
- Enbridge Gas Distribution and its affiliates
distribute natural gas to more than 2.0 million
customers in central and eastern Ontario, Quebec,
New York State and New Brunswick - Owns and operates 36,000 km of pipelines in
Ontario - Over the past 3 years, added an average of about
36,000 customer annually - ESRI user since 2011
3
Our industry faces a number of challenges that
are changing how we manage.
- Public expectations have changed
- Public want to more information and have more
questions - Regulators and politicians are responding to the
public - Shaped by Social media and other information
sources - Consumerization of technology
- Safety, reliability, and risk management continue
to have increased focus - Urban sprawl, urban density Creates a complex
underground environment - Distributed energy infrastructure
- Optimizing Risk vs Costs vs Performance
- Capital investment needs a defined purpose, need,
and timing - Regulators want to know what is needed? Why? And
when? - Information Management and Security
- Convergence of Information Technology/Operational
technology - Emergence of Smart Systems connected to
technology infrastructure - Large amounts of data being created and need to
be managed - Data residing across multiple systems
4
We developed a Business and Technology Roadmap
that helped us prepare for the future..
- Started by defining business outcomes we were
aiming for - Identified the capabilities required to achieve
business outcomes - Defined the timing of when the capabilities would
be required - Reviewed the current technology landscape
- Developed a future technology and investment plan
to match the capabilities to and outcomes to be
achieved - Governed the roadmap
- In 2009, GIS was identified as critical
technology to exploit in our Asset and Integrity
management practices - We have been leveraging ESRI technology for over
2 years
Core GIS
5
We are leveraging the power of GIS in many ways
today
Where is this corrosion area that needs to be
inspected?
Where is this emergency located?
Where is this locate being requested?
Where is this pressure alarm being triggered from?
Operations Survey
Damage Prevention
WMC
Where are the integrity mains that should be
pigged this year?
Where is this new pipes proposed location?
What areas do we focus this campaign on?
M R
Where are non-customers on mains?
Construction
Integrity Management
Marketing
Where are my leads and opportunities?
Where is this leaking pipe thats been detected?
Could we get gas to this customer?
Business Development
Customer Connections
Sales Enquiry
Operations
6
Our use of GIS continues to expand within the
organization..
- Use of GPS to capture location of the gas network
assets and land base features - Enhancing our accuracy, completeness, and timing
of information - Wireless data download and upload
- Aimed at removing the paper based processes
7
Consolidation of information from different
systems helps provide a unified view of work
activity
Location of Lead and potential opportunities
Consolidates work information and streamlines
communication
- Consolidates data from different systems to
provide a unified view of Work and Asset
information. - Helps identify potential environmental issues
- Right information to the right users at the right
time
Identify potential environment issues Creeks,
Railway, Conservation Areas
8
Connection to operational technology enhances
monitoring and control of the network..
- Shows the pressure recorders which qualify the
filter criteria, and the map shows the location
of individual recorders marked with blue balloons - Helps manage and prevent potential outages and
emergencies
Pressure readings captured the last 24-hours
High, Low, and Average pressure.
Lists the pressure recorders the location of
individual records are marked with blue balloons
9
Visualizing Work request distribution enhances
risk assessment and mitigation activities
- Shows the distribution of Work Requests which are
on critical Mains or in its vicinity. The
critical mains are those which operate at very
high pressure. - Helps monitor and manage 3rd party work around
critical mains - The Network Operations Center monitors these work
requests for proactive risk assessment and
mitigation
Distribution of Work Requests which are on
critical Mains or in its vicinity
Distribution of Work Requests which are on
critical Mains including polygons of projects
10
Assists in planning network analysis and risk
management..
- Assists in planning network expansion and
analysis - Building cascading models faster for analysis and
decision making - In event of an emergency, models can be built in
near real-time to asses impact on the network
11
The Long view..
- Incidents are preventable and to become highly
reliable industry we will need to rely on
location information and other data for decision
making - In order to eliminate the risk of incidents, we
need to know more information of our assets in
real time. Location analytics will become very
important - Smart Systems where assets will communicate
condition and state information is the future - Large amounts of data will be created and will
need to be processed into useable information for
decision making - Information management and security will continue
to be critical and understanding the practices
will become important for all executives - Platforms like GIS will become the backbone of
asset information and analytics and related
decision making - Organizational commitment and leadership will
continue to define success - We have leveraged GIS and will continue to do so,
in order to realize the benefits of abundant,
safe, reliable, and economical energy source and
increase public confidence in what we do
12
(No Transcript)
Recommended
CrystalGraphics Presentations


