
Standard Interferon vs. Pegylated Interferon - PowerPoint PPT Presentation
Title:
Standard Interferon vs. Pegylated Interferon
Description:
Standard Interferon vs. Pegylated Interferon * P – PowerPoint PPT presentation
Number of Views:215
Avg rating:3.0/5.0
Title: Standard Interferon vs. Pegylated Interferon
1
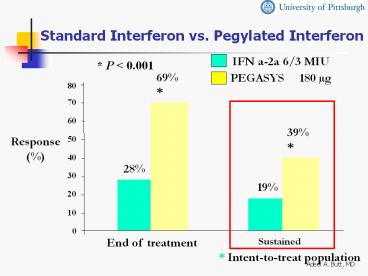
Standard Interferon vs. Pegylated Interferon
P lt 0.001
69
80
70
60
39
Response()
50
40
28
30
19
20
10
0
End of treatment
Sustained
Intent-to-treat population
2
Standard Interferon vs. Pegylated Interferon
Genotype 1
40
28
30
Patients with Response ()
20
7
10
0
IFN ?-2a
PEG -IFN
Zeuzem et al. NEJM 2000 3431666-1672
3
Standard Interferon vs. Pegylated Interferon
Genotype 2,3
56
60
50
37
40
Patients with Response ()
30
20
10
0
IFN?-2a
PEG -IFN
Zeuzem et al. NEJM 2000 3431666-1672
4
PEG alone vs. IFNRBV vs. PEGRBV
IFN ?-2b RBV (n 444)
PEG-IFN ?-2a Placebo (n 224)
PEG-IFN ?-2a RBV (n 453)
Age (mean, y) 42.3 42.4 42.8 Male
Gender 68 73 71 Weight (kg) 78.9 78.1 79.6 Geno
type 1 64 64 66 2 and
3 31 33 31 HCV RNA Titers (mean, 106
c/mL) 5.9 6.0 6.1 Cirrhosis 15 12 12
Fried MW et al. NEJM 2002
5
PEG alone vs. IFNRBV vs. PEGRBVSustained
Virologic Response
P 0.001 for all comparisons
56
60
n 453
45
40
n 444
30
Patients
n 224
20
0
IFN ?-2b RBV
PEG-IFN ?-2a Placebo
PEG-IFN ?-2a RBV
Fried MW et al. NEJM 2002
6
PEG alone vs. IFNRBV vs. PEGRBVSustained
Virologic Response by Genotype
80
76
70
61
60
of Patients
46
45
50
n 140
37
40
n 298
n 145
30
n 69
21
n 285
20
n 145
10
0
Genotype 1
Genotype 2, 3
PEG-IFN ?-2a PlaceboIFN ?-2b RBV PEG-IFN
?-2a RBV
7
IFNRBV vs. Low Dose PEGRBV vs. High Dose
PEGRBV
80
P .01
P .73
60
54
47
47
SVR ()
40
20
(n 511)
(n 505)
(n 514)
0
PEG (12 kDa) IFN alfa-2b 1.5 / 0.5 ?g/kg RBV
1000-1200 mg
PEG (12 kDa) IFN alfa-2b 1.5 ?g/kg RBV 800 mg
IFN alfa-2b 3 MIU TIW RBV 1000-1200 mg
Manns et al. Lancet. 2001358958-965.
8
(No Transcript)
9
Side Effects of IFN
- Psychiatric symptoms
- Depression
- Mood lability
- Injection site reaction
- Autoimmunity
- Lab alterations
- Neutropenia
- Anemia
- Thrombocytopenia
- Flu-like symptoms
- Headache
- Fatigue or asthenia
- Myalgia, arthralgia
- Fever, chills
- Nausea
- Diarrhea
- Alopecia
- Thyroiditis
10
Side Effects of RBV
- Hemolytic anemia
- Teratogenicity
- Cough and dyspnea
- Rash and pruritus
- Insomnia
- Anorexia
Rebetron? package insert. Kenilworth, NJ
Schering Corp 1999.
11
PEG (12 kDa) IFN alfa-2b Incidence of
Discontinuations Due to Adverse Events
14
13
13
14
12
10
8
Percent
6
4
2
0
IFN alfa-2b RBV
PEG IFN alfa-2b (12 kDa) 1.5 µg/kg RBV
PEG IFN alfa-2b (12 kDa) 1.5/0.5 µg/kg RBV
IFN interferon PEG polyethylene glycol RBV
ribavirin.
12
HCV-HIV Co-infection
13
HCV and HIV - Similarities
HCV
HIV
- ssRNA Flavivirus
- Virions/d 1012
- Diversity/complexity
- Six genotypes
- Tropism hepatocyte
- Receptors LDL, CD81
- ssRNA Retrovirus
- Virions/d 1010 - 1011
- Diversity/complexity
- 11 clades
- Tropism lymphoid
- Receptors CD4, CCR5
HIV
CCR5 chemokine receptor 5 CD4 cluster of
deviation 4 CD81 cluster of deviation 81 LDL
low density lipoprotein ssRNA positive
single strand ribonucleic acid.
14
HCV and HIV
- Prevalence of HCV in HIV gt 10x general population
- Reported to be between 30-50
- 6 of VA population HCV infected
- 35-43 of HIV infected veterans have HCV
Greub, Lancet 20003561800-5
15
Hepatitis C Virus and HIV Liver-Related Mortality
80
- UK hemophilia population, 1985-1998
- Deaths due to liver disease
- HIV - ? 16.7-fold
- HIV ? 94.4-fold
- Risk ? after 10 years
60
Deaths Due to Liver Disease (O/E)
40
20
0
HIV
HIV-
GP
GP general population HIV human
immunodeficiency virus O/E observed to
expected.
16
Increasing Mortality From ESLD in Patients With
HIV
- One third of 1998 cohort had recent history of
discontinuing HAART secondary to hepatotoxicity - More than 1/2 who died with ESLD had either NDVL
or CD4 gt200/mm3 6 months prior to death
50 40 30 20 10 0
50
1991
1996
1998
ESLD-Related Deaths ()
14
11
ESLD end stage liver disease NDVL no
detectable viral load.
17
HCV-HIV Co-infection
- Progression of liver disease accelerated in
HCV-HIV co-infected patients - Median time to cirrhosis 7 years in HCV-HIV vs.
23 years in HCV alone
Soto, J Hepatol 1997261-5
18
HCV-HIV Co-infection
Effect of HCV on HIV Progression CONTROVERSIAL
- More AIDS at baseline
- More progression
- Decreased CD4 recovery
- Greub, Lancet 2002
- De Luca, Archives 2002
- Generally no increase in HIV progression
- No difference in survival, progression from HIV
to AIDS or AIDS to death or HIV to death - Rate of decline of CD4 counts is also similar
- Dorrucci, JID 19951721503-8
- Staples Clin Infect Dis 199829150-4
- Sulkowski JAMA 2002
19
PEG-IFN RBV is associated with a superior week
24 virologic response (VR)
IFN R PEGIFN R
n67 n66 p value
Overall Wk 24 VR 10 (15) 29
(44) 0.0003 genotype 1 4/52 (7) 17/51
(33) 0.0014 genotype non-1 6/15 (40) 12/15
(80) 0.06 biochemical response 44 54
NS
intent to treat Genotype 1 vs. non-1, p lt
0.0001
Slide courtesy of R. Chung
20
A significant portion of virologic nonresponders
experience histologic response (HR)
IFN R PEGIFN R
n67 n66 p value
Virologic nonresponders 57 (85) 37 (56)
0.0003 Wk 24 Bx obtained 37
23 Histologic response 15 (40) 6
(26) 0.28 Combined virologic and histologic
response VR HR 25 (37) 35 (53)
0.08
Slide courtesy of R. Chung
21
Grade 4 events
IFN R PEGIFN R
n 67 n 66 p value
Grade 0-1 18 9 NS Grade 2 25 18 NS Grade
3 20 22 NS Grade 4 4 17 0.0012 ANC (lt
500) 3 7 NS gluc (gt 500) 0 4 NS plt (lt
20K) 0 1 NS LFTs (gt 10x ULN) 0 2 NS depressio
n 1 0 NS Premature D/C 8 (12) 8 (12) NS
Slide courtesy of R. Chung
22
Absolute CD4 fell but CD4 rose
IFN R PEGIFN R p value
Wk 0 CD4 452 500 0.07 CD4 24.0 25.5 0.19
Wk 24 CD4 369 363 0.80 CD4 27.0 30.5 0.10
DCD4 W0-24 -112 -194 0.01 DCD4
W0-24 2.5 3.5 0.14
overall 3.0, p 0.0001
Slide courtesy of R. Chung
23
There was no adverse effect on HIV-1 control
HIV RNA Total IFN R
PEGIFN R n 119
n 62 n 57 p
W0 W24 und und 59 (50) 32 (52) 27
(47) NS und det 9 (8) 6 (10) 3
(5) NS det und 16 (13) 6 (10) 10
(5) NS det det 35 (29) 18 (29) 17
(30) NS W0 undetectable 38
(62) 30 (52) NS W24
undetectable 38 (62) 37 (65) NS
Slide courtesy of R. Chung
24
HCV-HIV Co-infected Patients
- 51 patients
- IFN alfa 2b, 3 million units TIW PLUS RBV
1000-1200 - 12 months
- 59 genotype 1
- Cirrhosis 55
- Mean CD4 411
Landau. AIDS 2001152149-2155.
25
HCV-HIV Co-infected Patients
- ETVR 29
- SVR 21
- CD4 drop at end of treatment 51
- normalized after 6 months
- Treatment discontinuation 29
Landau. AIDS 2001152149-2155.
26
Hepatotoxicity in Co-infected Patients
- May be more common in co-infected patients, esp.
those on PI based regimens - However, overall risk small
- 88 co-infected patients on HAART had NO toxicity
- Reversible in those in whom it occurred
- Difficult to provide guidelines on management
- Stop or change therapy if liver enzymes gt 3-5
times ULN
Sulkowski, JAMA 200028374-80.
27
Managing Depression
- Take psychiatric history for depression and mania
- Develop relationship with mental health providers
- Treat preexisting depression before starting
(PEG) IFN - Evaluate patients for development of depression
at least every 2 weeks after initiation of IFN
therapy - Mild depression evaluate weekly
- Moderate depression reduce dose of IFN
consider psychiatric consultation - PEG IFN alfa-2a reduce to 135 µg weekly
- PEG IFN alfa-2b reduce dose by 1/2
- Severe depression discontinue IFN/RBV
immediately and permanently obtain immediate
psychiatric consult
28
Management of Neutropenia
- Neutropenia
- Consider G-CSF 300 µg SC BIW or TIW
- No controlled trials demonstrating
effectiveness - Clinical experience shows this to be effective
- ANC lt750 cells/mm3 dose reduce IFN
- PEG IFN alfa-2a decrease to 135 µg weekly
- PEG IFN alfa-2b decrease dose by 1/2
- ANC lt500 cells/mm3 discontinue IFN
GCSF granulocyte-colony stimulating factor.
29
Management of RBV-Induced Anemia
- Hemoglobin determinations pretreatment, at week
2, week 4, and as needed - If gt10 g/dL no action needed
- If lt10 g/dL reduce RBV dose to 600 mg daily
- If lt8.5 g/dL stop RBV
- If decreases by gt2 g/dL from starting
therapyreduce dose to 600 mg daily in patients
with cardiac history - Hemoglobin returns to baseline within 4 weeks
after RBV is stopped - Cardiac function
- Anemia may exacerbate symptoms of coronary
disease and/or deteriorate cardiac function - Recommend stress test for patients aged gt50 years
- Consider epoetin alfa 40,000 IU SC QW
30
Conclusions
- HCV is a common disease and a frequent cause of
morbidity and mortality in the US and globally - Current treatment options can eradicate/cure HCV
in a significant proportion of chronically
infected patients - Very few eligible patients actually receive
treatment - HCV co-infection is very common in the HIV
infected patients - Treatment is associated with significant adverse
- events, especially in the HCV-HIV co-infected
- patients
- Benefits of treatment should be weighed against
- the risks, considering the long natural
history of - the disease