
Trend Lines - PowerPoint PPT Presentation
Title:
Trend Lines
Description:
24,155 2 26,872 4 29,119 6 33,482 8 37,004 10 40,653 * * * * * * * * * * * * * * * * * * * * * * * * Trend Lines Linear: Approx. 46,956 students in 2004 Approx ... – PowerPoint PPT presentation
Number of Views:37
Avg rating:3.0/5.0
Title: Trend Lines
1
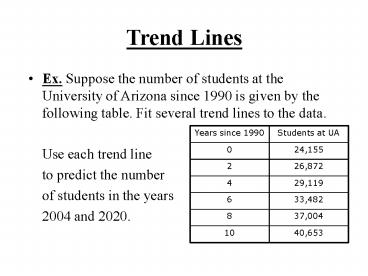
Trend Lines
- Ex. Suppose the number of students at the
University of Arizona since 1990 is given by the
following table. Fit several trend lines to the
data. - Use each trend line
- to predict the number
- of students in the years
- 2004 and 2020.
Years since 1990 Students at UA
0 24,155
2 26,872
4 29,119
6 33,482
8 37,004
10 40,653
2
Trend Lines
- Linear Approx. 46,956 students in 2004
- Approx. 73,756 students in 2020
3
Trend Lines
- Quadratic Approx. 49,976 students in 2004
- Approx. 100,478 students in 2020
4
Trend Lines
- Exponential Approx. 50,493 students in 2004
- Approx. 117,710 students in 2020
5
Demand, Revenue, Cost, Profit
- Ex. Suppose the following data represents the
total number of shoes sold in a month at a
particular price in - dollars. Use a second
- degree polynomial
- trend line to find a
- formula for the Demand
- function
Number of shoes Price
200 76
350 68
450 59
700 53
900 40
1100 24
6
Demand, Revenue, Cost, Profit
7
Demand, Revenue, Cost, Profit
- Generating graph of revenue
- Use Plotting Points method
- Use interval 0, q where q is the q-intercept
from Demand graph
8
Demand, Revenue, Cost, Profit
9
Demand, Revenue, Cost, Profit
- Optimal quantity to maximize revenue is about 800
units. - Maximum Revenue is about 36,000
- Price should be about 45
10
Demand, Revenue, Cost, Profit
- Ex. If the fixed cost is 2000 and the variable
cost is 35 per unit, determine a formula for
total cost and graph C(q). - C(q) 2000 35q
11
Demand, Revenue, Cost, Profit
12
Demand, Revenue, Cost, Profit
- Graph of Revenue and Cost (determine profit)
13
Demand, Revenue, Cost, Profit
- Profit function P(q) R(q) - C(q)
14
Demand, Revenue, Cost, Profit
- Project (Demand)
15
Demand, Revenue, Cost, Profit
- Project
- - Keep units straight
- - Prices (dollars)
- - Revenue (millions of dollars)
- - Quantities in test markets (whole units)
- - Quantities in national market (thousands of
units)
16
Demand, Revenue, Cost, Profit
- Project (Demand)
- - Convert test market data to national data
- - Determine quadratic demand trend line (8
decimal places)
17
Demand, Revenue, Cost, Profit
- Project (Revenue)
- - Units should be millions of dollars
- - Typically
- - Must adjust for units
18
Demand, Revenue, Cost, Profit
- Project (Revenue)
- Must convert revenue to millions of dollars
- Use this formula
19
Demand, Revenue, Cost, Profit
- Project (Revenue)
20
Demand, Revenue, Cost, Profit
- Project (Cost)
- - Use COST function from Visual Basic Editor
- (will be explained in class)
21
Demand, Revenue, Cost, Profit
- Project (Cost)
- 7 parameters for COST function
- quantity
- fixed cost
- batch size 1
- batch size 2
- marginal cost 1
- marginal cost 2
- marginal cost 3
22
Demand, Revenue, Cost, Profit
- Project (Revenue and Cost)
- - Graph both R(q) and C(q)
- - Use plotting points method
23
Demand, Revenue, Cost, Profit
- Project (Revenue and Cost)
24
Demand, Revenue, Cost, Profit
- Project (Profit)
25
Demand, Revenue, Cost, Profit
- Project (Revenue and Cost)
- - Determine important information from graphs
- Break-even pts at about
300,000 and 800,000 units - (zero profit)
- Max profit at about 575,000
units - Negative profit q lt 300K
and q gt 800K
Break-even pts
Largest gap max profit
26
Demand, Revenue, Cost, Profit
- Project (Revenue and Cost)
- - Determine important information from graphs
- Break-even pts at about
300,000 and 800,000 units - (zero profit)
- Max profit at about 575,000
units - Negative profit q lt 300K
and q gt 800K
Max profit
Break-even pts
27
Demand, Revenue, Cost, Profit
- Project (What to do)
- - Create Demand graph using trend lines
- - Create Revenue and Cost graph
- - Create Profit graph