
Paired t-test Exercise - PowerPoint PPT Presentation
Title:
Paired t-test Exercise
Description:
Exercise objective: Utilize what you have learned to conduct and analyze a paired t-test using MINITABTM. 1. A corrugated packaging company produces material which ... – PowerPoint PPT presentation
Number of Views:38
Avg rating:3.0/5.0
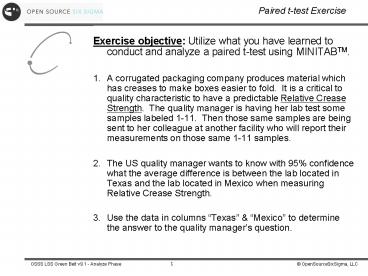
Title: Paired t-test Exercise
1
Paired t-test Exercise
- Exercise objective Utilize what you have learned
to conduct and analyze a paired t-test using
MINITABTM. - 1. A corrugated packaging company produces
material which has creases to make boxes easier
to fold. It is a critical to quality
characteristic to have a predictable Relative
Crease Strength. The quality manager is having
her lab test some samples labeled 1-11. Then
those same samples are being sent to her
colleague at another facility who will report
their measurements on those same 1-11 samples. - 2. The US quality manager wants to know with 95
confidence what the average difference is between
the lab located in Texas and the lab located in
Mexico when measuring Relative Crease Strength. - 3. Use the data in columns Texas Mexico to
determine the answer to the quality managers
question.
2
Paired t-test Exercise Solution
- Because the two labs ensured to exactly report
measurement results for the same parts and the
results were put in the correct corresponding
row, we are able to do a paired t-test. - The first thing we must do is create a new column
with the difference between the two test results.
CalcgtCalculator
3
Paired t-test Exercise Solution
- We must confirm the differences (now in a new
calculated column) are from a Normal
Distribution. This was confirmed with the
Anderson-Darling Normality Test by doing a
graphical summary under Basic Statistics.
4
Paired t-test Exercise Solution
- As weve seen before, this 1 Sample T analysis is
found with - StatgtBasic Statgt1-sample T
5
Paired t-test Exercise Solution
- Even though the Mean difference is 0.23, we have
a 95 confidence interval that includes zero so
we know the 1-sample t-tests null hypothesis was
failed to be rejected. We cannot conclude the
two labs have a difference in lab results.
The P-value is greater than 0.05 so we do not
have the 95 confidence we wanted to confirm a
difference in the lab Means. This confidence
interval could be reduced with more samples taken
next time and analyzed by both labs.