
WELCOME TO GENDER DISAGGREGATED DATA - PowerPoint PPT Presentation
Title:
WELCOME TO GENDER DISAGGREGATED DATA
Description:
Vetiver Grass. 6.0 6.1.1. 6.2.1. 6.3 6.3.1. 6.3.2. 8.2 LIVESTOCK EXTENSION. ... Mostly Hand cultivation ...3. Fertiliser codes (Col 6) Mostly Organic Fertiliser .1 – PowerPoint PPT presentation
Number of Views:55
Avg rating:3.0/5.0
Title: WELCOME TO GENDER DISAGGREGATED DATA
1
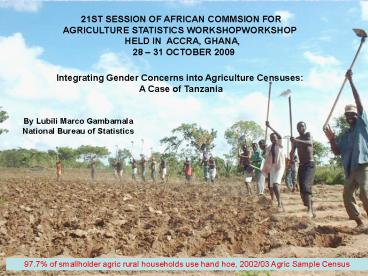
21ST SESSION OF AFRICAN COMMSION FOR AGRICULTURE
STATISTICS WORKSHOPWORKSHOP HELD IN ACCRA,
GHANA, 28 31 OCTOBER 2009
Integrating Gender Concerns into Agriculture
Censuses A Case of Tanzania
By Lubili Marco Gambamala National Bureau of
Statistics
97.7 of smallholder agric rural households use
hand hoe, 2002/03 Agric Sample Census
2
- Contents
- Introduction
- The Gender Profile of small holder Rural
Agriculture Households in Tanzania - The list of Gender indicators
- The snapshot of the Gender Profile in Tanzania
- The DATA Collection Tools and improvements made
for the 2007/08 Agriculture Sample Census
Questionnaire - Conclusion and Recommendations
3
1. Introduction
Feminization of the agriculture Sector
- In most developing countries there has been an
increasing trend towards what is been termed as
the 'feminization of agriculture'. - As men's participation in agriculture declines,
the role of women in agricultural production
becomes more dominant. - Involvements in high risk activities like mining,
War, fishing, hunting, burglary, death from
HIV/AIDS have reduced rural male populations. - migration of men from rural areas to towns and
cities, in their own countries or abroad, in
search of paid employment. - On the other hand the division of labour and
responsibilities between sexes in rural agrarian
communities has been set - by various cultural, religious and sometimes
political norms. - one of the sexes being disadvantaged in relation
to access to natural resources, rural
infrastructure, education, health and other
services. - It is often women who are more disadvantaged than
men
4
Feminization of ..cont
Gender analysis is a tool used to provide a
better understanding of the realities of men and
women and boys and girls. It aims to expose the
dynamics of gender-based differences across a
variety of issues
- Social relations i.e. how men and women are
defined in the given context, in their normative
roles, duties and responsibilities - Activities i.e. the division of labour in both
productive and reproductive work within the
household and the community - Access and control over resources, services,
institutions of decision making and networks of
power and authority and - Needs, the distinct needs of men and women, both
practical and strategic needs. - Gender analysis assumes that men and women differ
in the goods and services they produce and in
their degree of access to and control of
resources.
5
The Gender Profile of small holder Rural
Agriculture Households in Tanzania
The Gender Profile of small holder Rural
Agriculture Households in Tanzania provide an
insight of the extent of the differences which
are happening between male and females in rural
areas and the information can be used by the
planning and the policy making community to
alleviate the situation.
The 2002/3 and 2007/8 Agriculture Sample Censuses
are designed to meet the data needs of a wide
range of users down to district level including
policy makers at local, regional and national
levels, rural development agencies, funding
institutions, researchers, NGOs, farmer
organizations, etc. Specifically the Gender
Profile was meant to provide information to meet
the following list of indicators
6
The list of Gender differences indicators
Category of enquiry Issues to be considered / data to be collected
Agricultural population Agricultural population by sex and age Active agricultural population by sex and age and involvement in agricultural activities Agricultural holders/heads of agricultural households by sex and main sources of income Dependency ratios by sex of head of agricultural household .i.e. number of dependents versus number of adults in male and female headed households Education status of the head of household by sex Education status of the active agricultural population by sex of head of household Off-farm income of active agricultural population by sex and age category (youth, active, elderly) by sex of head of household
Access to and control over productive resources or assets To what extent do females and males have access to land, credit, markets, extension services, agricultural inputs, livestock, forest resources, fish, animal production and technologies
Labour concerns - gender based participation in agricultural production Gender based participation in crop production, animal production, fish farming and forest exploitation Who is responsible for maintenance of human resources
Storage, processing and marketing of agricultural produce Differences between male and female headed households involvement in storage, processing and marketing
Access to credit Main forms of credit available to male and female heads of households Levels of credit Use of credit
Access to domestic resources Gender-based differences in accessing housing, energy, clean water and sanitation Ownership of small assets like radios or bicycles
Poverty reduction Access to basic services Impact of the land act on womens access to land Income related poverty issues Other cross -cutting issues
7
The snapshot of the Gender Profile in Tanzania
- The total number of agriculture households
increased from 4,396,406 in 1997/1998 to
4,805,314 in 2002/2003, an increase of 8.5
percent over a 4 year period. There has been a
larger increase in female headed households than
male headed households (8 increase for male
headed households and 14 for female headed
households), - For the active agriculture population in
Tanzania, the result show that, 49 percent are
males compared to 51 percent females. - The illiteracy rate for male headed household is
21 percent compared to 51 percent for female
headed households. - The majority of households ranked annual crop
farming as their most important source of
livelihood and there is little difference between
male and female headed households.
8
The snapshot of the Gender Profile in Tanzania
- A higher percent of female headed households rely
on remittances compared to male headed
households. - Slightly higher percent of female headed
household members are involved in off farm income
generating activities compared to male headed
households (44 and 39 respectively) - Female headed households have a higher percent of
children that are orphans 2.3 compared to male
headed households 1.2. - Male headed households have 1.1 hectares more
land than female headed households - Very few male headed households (12) have female
land holders, whilst 50 percent of female headed
households have female land holders. This means
that female headed households either have male
members that are holders or that female headed
households do not have secure rights to land and
further investigation is required to determine
this.
9
The DATA Collection Tools and improvements made
for the 2007/08 Agriculture Sample Census
Questionnaire
10
The DATA Collection Tools .
11
- Conclusion and Recommendations
- Most of the gender analysis employed in analyzing
the gender profile of small holder rural
agriculture households in Tanzania, concentrated
in identifying differences between male and
female headed households and whilst large
differences were detected in some variables, in
most cases the differences were small or absent.
- Future work on gender analysis of the agriculture
sector should not only concentrate on the
differences between male and female headed
households but also on differences based on the
percent or number of females within households as
it may be that cultural norms are maintained more
by male headed households than female headed
households and that the disparity between males
and females within a male headed households may
be larger than in female headed households.
12
THANK YOU FOR YOUR ATTENTION
Recommended
CrystalGraphics Presentations


