
Unusable - PowerPoint PPT Presentation
Title:
Unusable
Description:
Catch curve based on length composition data 3. Cumulative catch curve based on length composition data 4. Beverton and Holt s Z equation 5. Plot Z on effort 1. – PowerPoint PPT presentation
Number of Views:15
Avg rating:3.0/5.0
Title: Unusable
1
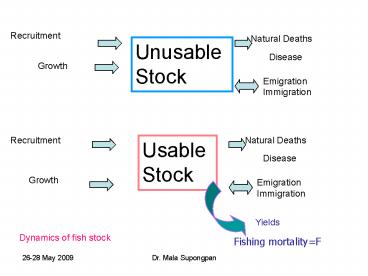
Recruitment
Natural Deaths
Unusable Stock
Disease
Growth
Emigration Immigration
Recruitment
Natural Deaths
Usable Stock
Disease
Growth
Emigration Immigration
Yields
Dynamics of fish stock
Fishing mortalityF
2
Can be controlled?
R Recruitment G Growth M Natural
mortality F Fishing mortality
HOW?
3
(No Transcript)
4
(No Transcript)
5
Yield against effort
CPUE against effort
Analytical methods
Holistic methods
6
(No Transcript)
7
The fish stock assessment needs
- Catches, Species and Sizes composition
- Abundance
- Biomass estimation
- Analytical methods and Holistic methods
- Parameter estimation (recruitment, growth,
mortality-natural - mortality, fishing mortality and total
mortality) - Catch and effort data from statistic record
(time series) - Population size and catchability
- Using catch per unit effort to find original
population size and - catchability
8
(No Transcript)
9
(No Transcript)
10
(No Transcript)
11
(No Transcript)
12
For virgin stock or limited data
1. Estimation of initial population size and
catchability coefficient from the fishing
success to catch or effort
Original population size
(Roughly virgin stock size)
ZMF ZMqf Fqf
catchability
Leslies method
Cumulative catch
DeLurys method
Cumulative effort
13
2. Estimation of Z using CPUE data
3. Natural mortality estimation
When no fishing
4. Fishing mortality estimation
FZ-M
14
Estimation of total mortality (Z)
1. CPUE data 2. Catch curve based on length
composition data 3. Cumulative catch curve based
on length composition data 4. Beverton and Holts
Z equation 5. Plot Z on effort
1. Estimate Z from CPUE data
From above equations, then gives
15
(No Transcript)
16
Biomass estimation
B CPUE A /aX1
B Biomass (tons/ km2)
A total area (km2) (101,384 km2)
a Swept Area DhX2 D (Vt) 2.51 h ( head rope) ( 39 m) X2 0.5
a (2.51.852) (0.0390.5) 0.090285
X1 0.5
X2 0.5
17
Swept area to estimate biomass
18
(No Transcript)
19
Survey strata by depth
20
Sustainable yield estimation
Virgin biomass
For conservation, a- should be0.3
ZB (FM)B and the catch Y FB
21
Definition Catchability ( ) A fraction of a
fish stock which is caught by a defined unit of
the fishing effort. When the unit is small
enough that it catches only a small part of the
stock-0.01 or less-it can be used As an
instantaneous rate in computating population
change. Also called catchability coeffifient.
22
Availability The fraction of a fish population
which lives in regions where it is susceptible
to fishing during a given fishing season. This
fraction receives recruits from or become
mingled with the non-available part of the stock
at other seasons, or in other years.
23
Catch per unit of effort (CPUE) The catch of
fish, in number or in weight, taken by a defined
unit of fishing effort. Also called Catch per
effort, fishing success, availability.
24
Biomass The weight of a fish stock, or of some
defined portion of it. Fishing effort The
total fishing gear in use for a specified
period of time. When two or more kinds of gear
are used, they must be adjusted to some standard
type.
25
References Gulland, J.A. 1983. Fish stock
assessment. (FAO/Wiley series on food and
agriculture v. 1), 223 pp. Ricker, W.E. 1975.
Computation and interpretation of
biological statistics of fish populations,
pp.151-155.
26
Exercises 1 and 2
Recommended
CrystalGraphics Presentations


