
RESULTS - PowerPoint PPT Presentation
1 / 1
Title: RESULTS
1
A Model Based Approach To Monitor
TemperatureDuring HIFU Thermal Therapy Guoliang
Ye, Penny Probert Smith, J. Alison Noble, and
Fares Mayia Dept. of Engineering Science,
Parks Road, University of Oxford, Oxford, UK.
ye, pjp, noble_at_robots.ox.ac.uk Dept. of
Medical Physics Clinical Eng., Oxford Radcliffe
Hospitals NHS Trust, Oxford, UK.
Fares.Mayia_at_orh.nhs.uk
- INTRODUCTION
- Temperature is the most critical
parameter for controlling tissue ablation through
HIFU. This poster discusses the improvements
which result from including a model of the
expected temperature distribution over space and
time, derived from the heat equation. A Kalman
filter, a well known stochastic estimator which
allows the uncertainty in the model and echo
strain measurements to be modelled explicitly, is
used to predict temperature through determining
the contours of constant temperature. Suitable
model parameters are derived through least
squares fitting algorithm based on the
temperature map estimated by echo-strain method.
The results allow the extent of tissue damage
caused by heating can be assessed readily. - THEORY METHOD
- 1. The Heat Model
- Assumptions A Gaussian-shaped heat
source is introduced in an infinite homogenous
media with uniform ambient temperature. 1 - The 3D Heat Model across a 2D
Cross-Section - where
- t the time since HIFU exposure and
heating. - H a constant which determines the
energy of the heat source. - tx ty tz the initial Gaussian
heat source introduced by HIFU
- RESULTS
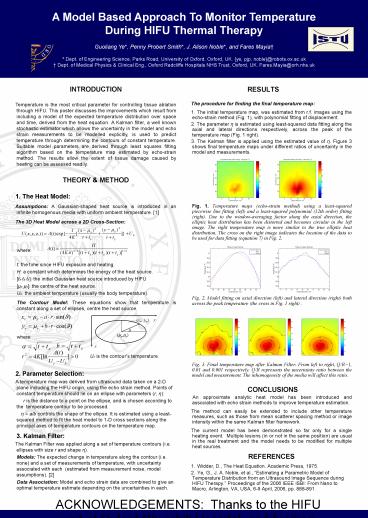
- The procedure for finding the final
temperature map - 1. The initial temperature map, was
estimated from r.f. images using the echo-strain
method (Fig. 1), with polynomial fitting of
displacement. - 2. The parameter ? is estimated
using least-squared data fitting along the axial
and lateral directions respectively, across the
peak of the temperature map (Fig. 1 right). - 3. The Kalman filter is applied
using the estimated value of ?. Figure 3 shows
final temperature maps under different ratios of
uncertainty in the model and measurements. - Fig. 1. Temperature maps (echo-strain method)
using a least-squared piecewise line fitting
(left) and a least-squared polynomial (12th
order) fitting (right). Due to the
window-averaging factor along the axial
direction, the elliptic heat distribution has
been distorted and becomes circular in the left
image. The right temperature map is more similar
to the true elliptic heat distribution. The cross
on the right image indicates the location of the
data to be used for data fitting (equation 7) in
Fig. 2.
y
(xr, yr)
(µx,µy)
x
Uc is the contours temperature.
ACKNOWLEDGEMENTS Thanks to the HIFU unit at
Oxford Churchill Hospital, and funding from EPSRC
grant EP/C00633X.