
Natural transgenic plant Festuca ovina - PowerPoint PPT Presentation
Title:
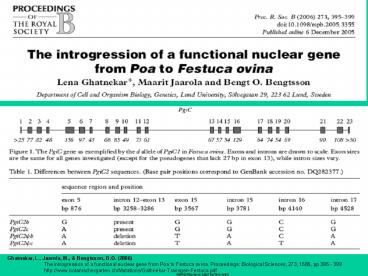
Natural transgenic plant Festuca ovina
Description:
Ghatnekar, L., Jaarola, M., & Bengtsson, B.O. (2006) The introgression of a functional nuclear gene from Poa to Festuca ovina. Proceedings: Biological Sciences, 273 ... – PowerPoint PPT presentation
Number of Views:61
Avg rating:3.0/5.0
Title: Natural transgenic plant Festuca ovina
1
Natural transgenic plant Festuca ovina
Ghatnekar, L., Jaarola, M., Bengtsson, B.O.
(2006) The introgression of a functional
nuclear gene from Poa to Festuca ovina.
Proceedings Biological Sciences, 273, 1585, pp
395 - 399 http//www.botanischergarten.ch/Mutati
ons/Gathnekar-Transgen-Festuca.pdf
2
Arber, Comparison
Werner Arber, Nobel Laureate 1978 Interestingly,
naturally occurring molecular evolution, i.e.
the spontaneous generation of genetic variants
has been seen to follow exactly the same three
strategies as those used in genetic
engineering14. These three strategies are (a)
small local changes in the nucleotide
sequences, (b) internal reshuffling of genomic
DNA segments, and (c) acquisition of usually
rather small segments of DNA from another type
of organism by horizontal gene transfer.
Arber, W. (2002) Roots, strategies and prospects
of functional genomics. Current Science, 83, 7,
pp 826-828 http//www.botanischergarten.ch/Mutati
ons/Arber-Comparison-2002.pdf Arber, W. (2002)
Roots, strategies and prospects of functional
genomics. Current Science, 83, 7, pp 826-828
http//www.botanischergarten.ch/Mutations/Arber-C
omparison-2002.pdf
3
Arber, However differences
However, there is a principal difference between
the procedures of genetic engineering and those
serving in nature for biological evolution. While
the genetic engineer pre-reflects his alteration
and verifies its results, nature places its
genetic variations more randomly and largely
independent of an identified goal. After an
average of 10 years of safety tests the Crops
are distributed to the millions in the field
Arber, W. (2002) Roots, strategies and prospects
of functional genomics. Current Science, 83, 7,
pp 826-828 http//www.botanischergarten.ch/Mutati
ons/Arber-Comparison-2002.pdf Arber, W. (2002)
Roots, strategies and prospects of functional
genomics. Current Science, 83, 7, pp 826-828
http//www.botanischergarten.ch/Mutations/Arber-C
omparison-2002.pdf
4
Intrinsic Value
van Bueren, E.T.L., Struik, P.C.,
Tiemens-Hulscher, M., Jacobsen, E. (2003)
Concepts of intrinsic value and integrity of
plants in organic plant breeding and propagation.
Crop Science, 43, 6, pp 1922-1929
http//www.botanischergarten.ch/Organic/van-Buere
n-Organicbreeding.pdf
5
Baudo comparison in genomic disturbance GM
crops are less disturbed (black dots) than
classic breeds
Scatter plot representation of transcriptome
comparisons, Baudo et al. 2006
transgenic vs. control endosperm 14 dpa
28 dpa
8 dpg
Baudo, M.M., Lyons, R., Powers, S., Pastori,
G.M., Edwards, K.J., Holdsworth, M.J., Shewry,
P.R. (2006) Transgenesis Has Less Impact on the
Transcriptome of Wheat Grain Than Conventional
Breeding. Plant Biotechnology Journal, 4, 4, pp
369-380 http//www.botanischergarten.ch/Organic/Ba
udo-Impact-2006.pdf Shewry, P.R. Jones, H.D.
(2005) Transgenic Wheat Where Do We Stand after
the First 12 Years? Annals of Applied Biology,
147, 1, pp 1-14 http//www.botanischergarten.ch
/Organic/Shewry-Performance-2006.pdf
2 conventional lines Endosperm 14 dpa
28 dpa
leaf at 8 dpg
transgenic vs. conventional Endosperm 14 dpa
28 dpa
leaf at 8 dpg
6
Explanation of the graphs in Baudo
Dots in black represent statistically
significant, differentially expressed genes
(DEG) at an arbitrary cut off gt 1.5.
The inner line on each graph represents no
change in expression.
The offset dashed lines are set at a relative
expression cut-off of twofold.
Coloured dots relative gene expression levels
reds indicate overexpression, yellows average
expression, greens under-expression.
Example b) middle in slide 6 2 conventional
lines compared in Endosperm at 28 dpa
Scatter plot representation of transcriptome
comparisons Dots represent the normalized
relative expression level of each arrayed gene
for the transcriptome comparisons described
7
Full caption of slide 6
Full caption of slide 6 Scatter plot
representation of transcriptome comparisons of
(a) transgenic B102-1-1 line vs. control L88-31
line in endosperm at 14 dpa (left), 28 dpa
(middle) or leaf at 8 dpg (right) (b)
conventionally bred L88-18 vs. L88-31 line in
endosperm at 14 dpa (left), 28 dpa (middle), or
leaf at 8 dpg (right) (c) transgenic B102-1-1
line vs. conventionally bred L88-18 line in
endosperm at 14 dpa (left), 28 dpa (middle), or
leaf at 8 dpg (right). Dots represent the
normalized relative expression level of each
arrayed gene for the transcriptome comparisons
described. Dots in black represent
statistically significant, differentially
expressed genes (DEG) at an arbitrary cut off gt
1.5. The inner line on each graph represents
no change in expression. The offset dashed lines
are set at a relative expression cut-off of
twofold. In the adjacent coloured bar
(rectangle on the far right of the figure), the
vertical axis represents relative gene expression
levels reds indicate overexpression, yellows
average expression, and greens under-expression.
Values are expressed as n-fold changes. The
horizontal axis of this bar represents the degree
to which data can be trusted dark or unsaturated
colour represents low trust and bright or
saturated colour represents high trust.
8
Transgenesis has less impact on the transcriptome
of wheat grain than conventional breeding
Differences observed in gene expression in the
endosperm between conventionally bred material
were much larger in comparison to differences
between transgenic and untransformed lines
exhibiting the same complements of gluten
subunits. These results suggest that the presence
of the transgenes did not significantly alter
gene expression and that, at this level of
investigation, transgenic plants could be
considered substantially equivalent to
untransformed parental lines.
9
Batista Microarray analysis Mutagenesis versus
Transgenesis, transcriptome changes
Batista, R., Saibo, N., Lourenco, T., Oliveira,
M.M. (2008) Microarray analyses reveal that plant
mutagenesis may induce more transcriptomic
changes than transgene insertion. Proceedings of
the National Academy of Sciences of the United
States of America, 105, 9, pp 3640-3645
http//www.botanischergarten.ch/Genomics/Batista-
Microarray-Analysis-2008.pdf
10
Semiholistic approach assessing the risk of 35S
promoter
Semi-holistic approach A paper on the 35S
promoters activities on animal cell cultures and
not mentioning that we eat this promoter daily
with our normal Food without ANY harm
Myhre, M.R., Fenton, K.A., Eggert, J., Nielsen,
K.M., Traavik, T. (2006) The 35s Camv Plant
Virus Promoter Is Active in Human Enterocyte-Like
Cells. European Food Research and Technology,
222, 1-2, pp 185-193 http//www.botanischergarte
n.ch/35S/Myhre-Cauliflower-Active-2006.pdf
11
Historic paper of McClintock about transposons
McClintock, B. (1950) The Origin and Behavior of
Mutable Loci in Maize. Proc Natl Acad Sci U S A,
36, 6, pp 344-55 http//www.ncbi.nlm.nih.gov/ent
rez/query.fcgi?cmdRetrievedbPubMeddoptCitatio
nlist_uids15430309 McClintock, B.
(1953) Induction of Instability at Selected Loci
in Maize. Genetics, 38, 6, pp 579-99
http//www.ncbi.nlm.nih.gov/entrez/query.fcgi?cmd
RetrievedbPubMeddoptCitationlist_uids172474
59 AND http//www.botanischergarten.ch/Genomics/Mc
Clintock-Instability-Maize-1953.pdf
12
Landrace from Switzerland Jumping Genes
Sectorial splitting 'Oberländer Mais from
Thusis' Grisons, Switzerland
Recommended
CrystalGraphics Presentations


