
A Tale of Two Streams - PowerPoint PPT Presentation
1 / 20
Title:
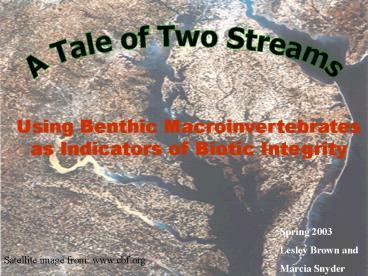
A Tale of Two Streams
Description:
Using Benthic Macroinvertebrates as Indicators of Biotic Integrity. Methods: Benthic Invert Sampling ... Benthic IBI Scores for PB and SAL ... – PowerPoint PPT presentation
Number of Views:35
Avg rating:3.0/5.0
Title: A Tale of Two Streams
1
A Tale of Two Streams
Using Benthic Macroinvertebrates as Indicators of
Biotic Integrity
Spring 2003 Lesley Brown and Marcia Snyder
Satellite image from www.cbf.org
2
Methods Benthic Invert Sampling
- Samples were taken from two sites in Montgomery
Countys Paint Branch watershed a treatment
Stewart April Lane in a highly urbanized
subwatershed (40ISA) and a reference Paint
Branch in a residential subwatershed with a
riparian buffer (9IPA). - In each of the two 75 m reaches, 20 1-square-foot
samples were taken with a D-net in habitat types
favorable to benthic macroinvert diversity. For
each sample, the substrate was disturbed and
rubbed to dislodge inverts.
- Contents of bucket were put through a
500micrometer filter and preserved in 70
ethanol. - In the lab, the samples were mixed with water,
and sub-samples were taken and sieved with a 500
micrometer filter. Sub-sampling finished when
100 individuals or greater were withdrawn.
3
Biological Integrity The capacity to support
and maintain a community of organisms with a
similar species composition and diversity to the
natural habitat of the ecoregion.
(MD DNR, 1999 Karr, 1981)
4
- Benthic Macroinvertebrates as Indicators
- long life cycles can show decline in
environmental quality - diverse exhibit a wide range
of responses to stressors - abundant makes sampling easier and more
cost-effective
5
Index of Biological Integrity (IBI) For benthic
macroinvertebrates developed from the MBSS data
collected 1994-1995. Tested for effectiveness in
1996-1997 (Stribling et al., 1999).
Trichoptera Hydropsychidae
Acariformes water mites
http//www.dec.state.ny.us/website/dow/stream/trif
amilypageone.htm
http//www.dec.state.ny.us/website/dow/stream/trif
amilypageone.htm
6
The Benthic Macroinvertebrates IBI
- Combines numerous characteristics of biological
assemblages into one parameter. - Allows scientists to use raw data to generate
assessments of site conditions. - Can be tailored specifically to regions in this
case non-Coastal Plain and Coastal Plain Maryland
Streams.
Diptera True Flies
http//www.dec.state.ny.us/website/dow/stream/trif
amilypageone.htm
7
Macroinvertebrate Functional Feeding Group
Composition
The presence or absence of FFG (groups of
organisms representing different behavioral/
morphological adaptations of food acquisition)
can reflect environmental stressors, such as
water quality or quantity.
(Cummins, 1994 Merritt and Cummins, 1996)
8
PB 2003
PB 2002
SAL 2003
SAL 2002
9
Scrapers remove periphyton or algae
Predators eat living animal tissue or prey
Collectors feed on OM deposited or trapped in
sediment or detritus Filterers trap and
strain POM from water column Shredders break-up
COM, woody or macrophyte pieces. Chironomids
different taxa are either predators, shredders
collectors, scrapers or filters since they were
left at the family-level, they were grouped as
their own entity.
10
Temporal Shifts
PB 2003
PB 2002
- Increase in scrapers
- Dec. in Chironomids
- Increase in collectors (Oligoceates)
- Decrease in shredders
- Increase in predators
- Increase in filterers
- Decrease in scrapers
- Dec. in Chironomids
- Increase in collectors (Oligocheates)
- Increase in shredders
- Increase in predators
- Increase in filterers
SAL 2003
SAL 2002
11
What do these temporal trends mean?
With Increasing Stressors Chironomids will
increase Oligocheata will increase
scrapers will decrease predators will
decrease shredders will decrease
collectors will decrease (but we only had
Oligocheates!)
- Therefore
- The results conflict one another for both SAL
and PB from 2002 to 2003, Oligocheates
increased (indicating increased stressors) but
Chironomids decreased. - Even though SAL was dominated by Oligocheates in
2003 compared to 2002, there was also more FFG
diversity. - From 2002 to 2003, PB loses its shredders, but it
becomes more evenly represented in its other FFG.
12
PB 2003
PB 2002
Reference vs. Impacted
- Decrease in of Chironomids
- Increase in of scrapers
- Increase in of collectors (Oligocheates)
- Disappearance of filterers, predators, and
shredders
- Decrease in of Chironomids
- Decrease in of scrapers
- Increase in of collectors (Oligocheates)
- Appearance of shredders
- Decrease in of predators filterers
SAL 2003
SAL 2002
13
What do these comparisons between PB and SAL mean
for data from 2003?
With Increasing Stressors Chironomids will
increase Oligocheata will increase
scrapers will decrease predators will
decrease shredders will decrease
collectors will decrease (but we only had
Oligocheates!)
Therefore All (with the exception of the
appearance of 2 shredders of Tipulidae) FFG
indicators regarding percent composition point to
increased stressors affecting SAL.
14
(No Transcript)
15
Abundances of Shared Families
Number of Individuals Collected
Family Names
16
Number of Individuals and Number of Taxa 2003
Number
17
Tolerance Values Based on a taxons ability to
survive stressors (such as thermal and chemical
pollution, alterations in hydrologic regime, or
habitat degradation). The scale used in this
analysis is taken from MBSS which is ultimately
based on the Hilsenhoff framework (Stribling et
al. 1999 Hilsenhoff 1982). Tolerance values
range from 0-10, with 0-3 being intolerant and
7-10 being tolerant.
18
Hilsenhoff Biotic Index for PB and
SAL (Hilsenhoff 1977 and Stribling et al. 1999)
The index is calculated as the average tolerance
value for the assemblage. Though not specifically
calibrated for MD, it can provide insight into
organic pollution.
Paint Branch 6.7 ? Poor Stewart April Lane
9.8 ? Very Poor
19
Benthic IBI Scores for PB and SAL
20
Compare our data to MBSS Results (1998 and 1999,
Stribling et al.)
MBSS Average for All of MD
Adapted from MBSS 95-97
2002 SAL sample only had 44 individuals!