
Agenda - PowerPoint PPT Presentation
1 / 52
Title:
Agenda
Description:
Bag CART. 4. Case study. FLDA. DLDA. DQDA. 4. Case study. 4. Case study. 4. Case study ... Bagging: 'Ipred' package. Random forest: 'randomForest' package ... – PowerPoint PPT presentation
Number of Views:41
Avg rating:3.0/5.0
Title: Agenda
1
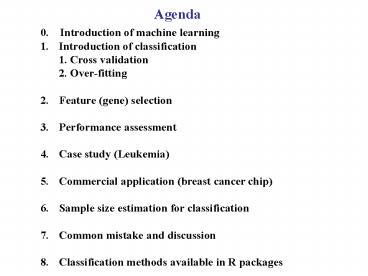
Agenda
- 0. Introduction of machine learning
- Introduction of classification
- 1. Cross validation
- 2. Over-fitting
- Feature (gene) selection
- Performance assessment
- Case study (Leukemia)
- Commercial application (breast cancer chip)
- Sample size estimation for classification
- Common mistake and discussion
- Classification methods available in R packages
2
Statistical Issues in Microarray Analysis
Experimental design
Integrative analysis meta-analysis
3
0. Introduction to machine learning
A very interdisciplinary field with long history.
Applied Math
Statistics
Computer Science Engineering
Machine learning
4
0. Introduction to machine learning
- Classification (supervised machine learning)
- With the class label known, learn the features of
the classes to predict a future observation. - The learning performance can be evaluated by the
prediction error rate. - Clustering (unsupervised machine learning)
- Without knowing the class label, cluster the data
according to their similarity and learn the
features. - Normally the performance is difficult to evaluate
and depends on the content of the problem.
5
0. Introduction to machine learning
6
0. Introduction to machine learning
7
0. Introduction to machine learning
8
1. Introduction to classification
Data Objects Xi, Yi(i1,,n) i.i.d. from joint
distribution X, Y. Each object Xi is associated
with a class label Yi?1,,K. Method Develop a
classification rule C(X) that predicts the class
label Y well. ( error rate i Yi?C(Xi)
) How is the classifier learned from the
training data generalize to (predict) a new
example. Goal Find a classifier C(X) with high
generalization ability. In the following
discussion, only consider binary classification
(K2).
9
1.1 Cross Validation
Data Objects Xi, Yi(i1,,n) i.i.d. from joint
distribution X, Y. Each object Xi is associated
with a class label Yi?1,,K. Method Develop a
classification rule C(X) that predicts the class
label Y well. ( error rate i Yi?C(Xi)
) How does the classifier learned from the
training data generalize to (predict) a new
example? Goal Find a classifier C(X) with high
generalization ability.
10
1.1 Cross Validation
Whole data
Training data
Testing data
Classifier
Calculate error rate
11
1.1 Cross Validation
- Independent test set (if available)
- Cross Validation
- V-fold cross validation
- Cases in learning set randomly divided into V
subsets of (nearly) equal size. Build classifiers
by leaving one set out compute test set error
rates on the left out set and averaged. - 10-fold cross validation is popular in the
literature. - Leave-one-out cross validation
- Special case Vn.
12
1.2 Overfitting
13
1.2 Overfitting
Overfitting problems The classification rule
developed overfits to the training data and
become not generalizable to the testing data.
- e.g.
- In CART, we can always develop a tree that
produces 0 classification error rate in training
data. But applying this tree to the testing data
will find large error rate (not generalizable)
- Things to be aware
- Pruning the trees (CART)
- Feature space (CART and non-linear SVM)
14
2. Gene selection
15
2. Gene selection
- Why gene selection?
- Identify marker genes that characterize different
tumor status. - Many genes are redundant and will introduce noise
that lower performance. - Can eventually lead to a diagnosis chip. (breast
cancer chip, liver cancer chip)
16
2. Gene selection
17
2. Gene selection
- Methods fall into three categories
- Filter methods
- Wrapper methods
- Embedded methods
- Filter methods are simplest and most frequently
used in the literature.
18
2. Gene selection
Filter method
- Features (genes) are scored according to the
evidence of predictive power and then are ranked.
Top s genes with high score are selected and used
by the classifier. - Scores t-statistics, F-statistics, signal-noise
ratio, - The of features selected, s, is then determined
by cross validation.
Advantage Fast and easy to interpret.
19
2. Gene selection
Filter method
- Problems?
- Genes are considered independently.
- Redundant genes may be included.
- Some genes jointly with strong discriminant power
but individually are weak will be ignored. - The filtering procedure is independent to the
classifying method.
20
2. Gene selection
Wrapper method
Iterative search many feature subsets are
scored base on classification performance and the
best is used. Subset selection Forward
selection, backward selection, their
combinations. The problem is very similar to
variable selection in regression.
21
2. Gene selection
Wrapper method
- Analog to variable selection in regression
- Exhaustive searching is not impossible.
- Greedy algorithm are used instead.
- Confounding problem can happen in both scenario.
In regression, it is usually recommended not to
include highly correlated covariates in analysis
to avoid confounding. But its impossible to
avoid confounding in feature selection of
microarray classification.
22
2. Gene selection
Wrapper method
- Problems?
- Computationally expensive for each feature
subset considered, the classifier is built and
evaluated. - Exhaustive searching is impossible. Greedy search
only. - Easy to overfit.
23
2. Gene selection
Wrapper method (a backward selection example)
Recursive Feature Elimination (RFE)
- Train the classifier with SVM. (or LDA)
- Compute the ranking criterion for all features
(wi2 in this case). - Remove the feature with the smallest ranking
criterion. - Repeat step 13.
24
2. Gene selection
Recursive Feature Elimination (RFE)
- 22 normal 40 Colon cancer tissues
- 2000 genes after pre-processing
- Leave-one-out cross validation
Dashed lines filter method by naïve
ranking Solid lines RFE (a wrapper method)
Guyon et al 2002
25
2. Gene selection
Embedded method
- Attempt to jointly or simultaneously train both a
classifier and a feature subset. - Often optimize an objective function that jointly
rewards accuracy of classification and penalizes
use of more features. - Intuitively appealing
- Examples nearest shrunken centroids, CART and
other tree-based algorithms.
26
2. Gene selection
- Common practice to do feature selection using the
whole data, then CV only for model building and
classification. - However, usually features are unknown and the
intended inference includes feature selection.
Then, CV estimates as above tend to be downward
biased. - Features (variables) should be selected only from
the training set used to build the model (and not
the entire set)
27
3. Performance assessment
28
3. Performance assessment
29
3. Performance assessment
30
4. Case study
From UCSF Fridlyand J
31
4. Case study
FLDA
DLDA
DQDA
KNN
DLDA
Bag CART
32
4. Case study
33
4. Case study
34
4. Case study
35
5. Clinical application (breast cancer chip)
- Background
- After treatment of breast cancer, further
chemotherapy or hormonal therapy is applied to
prevent tumor recurrence. - Determining whether a patient runs a high or low
risk of cancerous spread (metastasis), is
difficult. - Cancer is a disease of the genes. Gene expression
profile provides a better diagnosis tool than
clinical or pathological parameters.
36
5. Clinical application
37
5. Clinical application
38
5. Clinical application
39
5. Clinical application
40
5. Clinical application
41
5. Clinical application
42
5. Clinical application
43
5. Clinical application
Gene expression diagnosis is better than
traditional clinical parameters.
44
6. Sample size estimation
Intuitively the larger sample size, the better
accuracy (smaller error rate).
45
6. Sample size estimation
Estimating Dataset Size Requirements
for Classifying DNA Microarray Data SAYAN
MUKHERJEE, PABLO TAMAYO,SIMON ROGERS, RYAN
RIFKIN, ANNA ENGLE, COLIN CAMPBELL, TODD R.
GOLUB, and JILL P. MESIROV. JOURNAL OF
COMPUTATIONAL BIOLOGY Volume 10, Number 2, 2003
P119-142
46
6. Sample size estimation
Various theorems have suggested an
inverse-power-law e(n) error rate when sample
sizen. b Bayes error, the minimum error
achievable.
47
6. Sample size estimation
random permutation test
48
6. Sample size estimation
49
7. Common mistakes
- Common mistakes
- Perform t-statistics to select a set of genes
distinguishing two classes. Restrict on this set
of genes and do cross validation using a selected
classification method to evaluate the
classification error. - The gene selection should not apply to the whole
data if we want to evaluate the true
classification error. The selection of genes
already used information in testing data. The
resulting error rate is down-ward biased.
50
7. Common mistakes
- Common mistakes (contd)
- Suppose a rare (1) subclass of cancer is to be
predicted. We take 50 rare cancer samples and 50
common cancer samples and find 0/50 errors in
rare cancer and 10/50 for common cancer. gt
conclude 10 error rate! - The assessment of classification error rate
should take population proportions into account.
The overall error rate in this example is
actually 20. In this case, its better to
specify specificity and sensitivity separately.
51
7. Conclusion
- Classification is probably the analysis most
relevant to clinical application. - Performance is usually evaluated by cross
validation and overfitting should be carefully
avoided. - Gene selection should be carefully performed.
- Interpretability and performance should be
considered when choosing among different methods. - Resulting classification error rate should be
carefully interpreted.
52
Classification methods available in R packages
Linear and quadratic discriminant analysis lda
and qda in MASS package DLDA and DQDA
stat.diag.da in sma package KNN
classification knn in classpackage CART
rpart package Bagging Ipred package Random
forest randomForest package Support Vector
machines svm in e1071 package Nearest
shrunken centroids pamr in pamr package