
MapMan: a la carte painting of profiling data onto a template of your own design - PowerPoint PPT Presentation
1 / 38
Title:
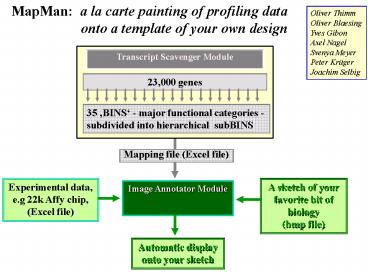
MapMan: a la carte painting of profiling data onto a template of your own design
Description:
Mapping file (Excel file) MapMan: a la carte painting of profiling data ... Repression of photosynthesis. Repression of chlorophyll synthesis ... photosynthesis ... – PowerPoint PPT presentation
Number of Views:296
Avg rating:3.0/5.0
Title: MapMan: a la carte painting of profiling data onto a template of your own design
1
MapMan a la carte painting of profiling data
onto a template of your own design
Oliver Thimm Oliver Blaesing Yves Gibon Axel
Nagel Svenya Meyer Peter Krüger Joachim Selbig
Image Annotator Module
2
Sorting genes into (rubbish) BINS, with the
SCAVENGER module
- Import existing categorised genes
3
Excerpt from a mapping file
BIN 3 is expanded to show its sub-BINS Sub-BIN
3.1 (raffinose metabolism) is expanded to the
level of single genes. - identified by a
unique identifier (Affy number
blablablablabla_at) - will carry the numeric
code 3.1
The mapping file (i) Re-organises the
experimental data file. - Groups
together all the genes that have a
particular numeric code (i.e., are in the
same BIN/sub-BIN). (ii) Provides the code
via which the resulting sets of data are
painted onto your pretty diagrams
4
The User takes a diagram of his/her choice, and
decides what data is displayed, where, and how
....
What data do you want to paint here ?
Data files
Type in BIN identifier
maps
Mapping files
Blue increase Red decrease Grey no call
White no change
How do you want to show it ?
5
Example of a map
Glycolysis
Mitochondrial electron transport and ATP synthesis
6
Extension of the night for 2h,
4h,
6h,
and 8h
Transcripts
7
Selective changes of expression of genes involved
in cell wall synthesis, breakdown and modification
Pectin esterases
synthesis
pectin lyases polygalacturonases
XETs Expansins
Break down
Transcripts
8
2h ext night
Painting at the pathway level
2 h into the extended night A few genes
induced No genes repressed
9
4h ext night
4 h into the extended night Some genes for
glycolytic enzymes are being repressed
10
6h ext night
6 h into the extended night Some genes for
glycolytic enzymes are being repressed
11
8h ext night
8 h into the extended night - Repression
becomes stronger and spreads to more genes
12
Cellular functions in an extended night after 2h,
Looking for changes in general functions
4h,
6h,
and 8h
13
Sugars regulate expression of 100s of genes
- - Central carbon metabolism
- Nitrate, ammonium, amino acid
- and nucleotide metabolism
- RNA and protein synthesis
- - Lipid metabolism
- Cell wall metabolism and
- modification
- - Secondary metabolism
- Hormone synthesis and sensing
- Signalling pathways
- Transcription factors
14
Integration with further experiments -
comparison with other nutrient challenges
Overlay plots
Arabidopsis grown in liquid culture under
continuous light with full nutrients, or with one
limiting ... Treatments Resupply 3mM sucrose
to sugar-depleted seedlings. Resupply 3mM
nitrate to nitrate-depleted seedlings. Resupply
3mM phosphate to phosphate-depleted
seedlings Resupply 3mM sulphate to
sulphate-depleted seedlings
15
Overlay the responses to identify similarities
and differences on a gene-to-gene basis
Increase by gt 1.0 in both Increase by gt 0.5 in
both Change by lt 0.5 in both Decrease by gt 0.5
in both Decrease by gt 1.0 in both Opposing
Responses
Mathematical correlation plot for all the genes
16
Direct overlay of the responses 6h extended
night vs. pgm
17
Overlay plot comparing the response of metabolism
to carbon and nitrate deficiency
Many non-shared responses
Shared Repress - Pectinesterases - Expansins, -
XETs - PolyGalUAases
Shared Induce many genes for
amino acid breakdown
18
Overlay plot comparing the response of metabolism
to nitrate and phosphate deficiency
Many shared responses
Induction of phenylpropanoid and flavanoid
metabolism
19
Overlay plot comparing the response of metabolism
to nitrate and sulphate deficiency
Many shared responses
Repression of photosynthesis
Repression of chlorophyll synthesis
Induction of phenylpropanoid and flavanoid
metabolism
20
Current Work
Ongoing correction of assignments by mining
public sites Establish pipelines to import
updates of annotation, and expert advice
Display clusters or other statistictically-generat
ed groupings of genes
Visualisation of metabolite profiling data
sets Combination of data-sets at different levels
Statistical treatment of the responses of
different BINS - rigorous support for
conclusions - data condensation to aid
compariosn of different treatments - support
automatic identification of co-regulated processes
Adapt display to give information about the
expression level as well as the change of
expression
Extend to visualise the expression of a small set
of genes-of-interest across a large collection
of arrays for different developmental stages,
organs , or treatments.
Use to organise and display data sets from crop
plants
21
PCA Analysis of transcript profiles - diurnal
cycles in wildtype (biological triplicates) -
extended night in wildtype (biological
duplicates) - diurnal cycles in pgm
(biological duplicates)
Wildtype Dark
Wildtype Extended night
Wildtype Light
Component 1 treatments lie on an axis from high
to low sugar
total of 40 arrays in 20 conditions
22
Correlation plot for 14,000 genes between
Weightings of transcripts in the first principle
component andChanges of transcripts in the
first 3 hrs after adding sugar to sugar-starved
seedlings in liquid culture
23
Changes after adding sugar to starved seedlings
1st component for diurnal changes and extended
night
Reciprocal plot
24
MapMan a la carte painting of profiling data
onto a template of your own design
Oliver Thimm Oliver Blaesing Yves Gibon Axel
Nagel Svenya Meyer Peter Krüger Joachim Selbig
Image Annotator Module
25
L. penelli metabolite profile painted out with
Mapman
In work
Changes are shown in false color relative to L.
esculentum
26
An introgression line with improved nitrogen
assimilation ....
In work
Changes are shown in false color relative to L.
esculentum
27
An introgression line with improved amino acid
biosynthesis....
In work
Changes are shown in false color relative to L.
esculentum
28
An introgression line with high levels of
stress-related metabolites
In work
Changes are shown in false color relative to L.
esculentum
29
(No Transcript)
30
(No Transcript)
31
(No Transcript)
32
(No Transcript)
33
Reprogrammning of metabolism after adding nitrate
back to deficient seedlings in liquid culture
Induce sucrose breakdown
Induce OPP cycle
Induce nitrate reduction
34
Responses can be resolved to the pathway level
35
Reprogrammning of metabolism after adding nitrate
back to deficient seedlings in liquid culture
Induce sucrose breakdown
Induce OPP cycle
Induce several XETs and expansins
Induce several FA desaturases
Induce photosynthesis
Why is Phe synthesis inhibited
Induce nitrate reduction
Induce sulphate reduction
Induce nucleotide synthesis and salvage
Induce amino acid synthesis
36
Nitrate readdition leads to major changes of
transcripts for large enzyme families involved in
biosynthetic and secondary metabolism
after 30 min,
3 hours
and 2 days
Many glucosyltransferases are repressed
Very widespread changes
37
Cellular responses to nitrate resupply .. after
30 min
... and 3 hours
38
(No Transcript)
Recommended
CrystalGraphics Presentations


