
Right: - PowerPoint PPT Presentation
1 / 1
Title: Right:
1
Aircraft FAGE Measurements of OH and HO2 over
West Africa during the AMMA Campaign,
July/August 2006
R. Commane1, C. Floquet1,2, T. Ingham1, D.
Heard1. 1School of Chemistry, University of
Leeds, Woodhouse Lane, Leeds, LS2 9JT, UK, 2Now
at the National Oceanography Centre, Southampton,
UK
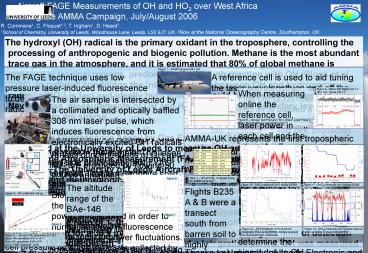
The hydroxyl (OH) radical is the primary oxidant
in the troposphere, controlling the processing of
anthropogenic and biogenic pollution. Methane is
the most abundant trace gas in the atmosphere,
and it is estimated that 80 of global methane is
removed in tropical regions, predominantly
through reaction with OH (Bloss et al 2005). In
polluted conditions the interconversion between
OH and hydroperoxy radicals (HO2) is fast and
ideally both species should be considered
together. Nevertheless, measurements of OH and
HO2 in the tropical boundary layer and free
troposphere are sparse. An airborne
Fluorescence Assay by Gas Expansion (FAGE)
instrument has been developed at the University
of Leeds to measure OH and HO2 on board the
Facility for Airborne Atmospheric Measurement
(FAAM) operated BAe-146 research aircraft (Figure
1). The University of Leeds Aircraft FAGE
instrument is one of a number of chemical and
meteorological instruments aboard, allowing a
comprehensive suite of measurements to be
obtained. During the AMMA Special Observation
Period 2 (SOP-2) based in Niamey, Niger during
July and August 2006, airborne measurements of
the concentrations of OH and HO2 radicals were
made. For a signal-to-noise ratio of 1, the
average limit of detection for OH was 7.2105
molecule cm-3 at 1100 m for a 30 s integration
period, whereas for HO2 the limit of detection
was 3.1106 molecule cm-3 at 1100 m for a 1 s
integration period. OH was measured on 7 flights
over 6 days and HO2 on 13 flights over 11 days.
1. Aircraft FAGE Instrument The FAGE technique
uses low pressure laser-induced fluorescence to
detect low concentrations of OH radicals. Ambient
air from outside the aircraft is sampled with an
inlet (Eisele et al, 1997), adapted for the
BAe-146 by Jack Fox (NCAR, Boulder, USA) mounted
on a window blank on the front starboard side of
the BAe-146 (Figure 2). The inlet aims to slow
the air prior to sampling, while minimising wall
contact and the associated loss of OH radicals.
The sampled air is expanded supersonically
through a 0.75 mm diameter pinhole into a low
pressure detection cell, the internal cell
pressure of which varies with aircraft altitude
from 1.0 2.4 Torr.
3. Measurement And Analysis A reference cell is
used to aid tuning the laser wavelength on and
off the peak of the OH Q1(2) rotational line.
Humidified air is passed over a glowing 8020
NiChrome filament in a low pressure 3 Torr
cell, producing OH radicals by thermolysis of
water vapour. The online measurement periods are
alternated with offline periods to determine the
signal solely due to OH fluorescence.
Figure 1 FAAM operated BAe-146
Figure 9 Black OH Signal (cts s-1) Red HO2
Signal (cts s-1)
When measuring online the reference cell, laser
power in each cell and the internal cell pressure
are all monitored (Figure 8). At the start of the
run prior to HO2 measurements, the NO valve is
closed to determine the signal due to OH in the
HO2 cell (Figure 9). This is then used as the HO2
background signal. Figures 8 and 9 are
simultaneous reference cell and OH and HO2
measurements.
The air sample is intersected by a collimated and
optically baffled 308 nm laser pulse, which
induces fluorescence from electronically excited
OH radicals present in the sample. This laser
pulse is provided by a NdYAG pumped Titanium
Sapphire solid state laser (Photonics Industries,
Bloss et al 2003). After traversing the
excitation region, the laser power is measured in
order to normalise the OH fluorescence signal to
laser power fluctuations. The fluorescence is
collected by a series of optics and delivered to
a gated photomultiplier tube. The individual
fluorescence photons are processed by photon
counting instruments and the signal recorded.
Temporal gating of the photon-counter is used to
isolate the OH fluorescence from the laser and
other scattered light. After the OH detection
axis, NO is added to the air flow to titrate HO2
present to OH. Once both detection axes are
calibrated, the OH signal detected in the HO2
axis can be converted to a HO2 concentration.
Figure 2 The Inlet
Figure 8 Orange Cell Pressure (Torr) Green
Laser Power (mW) Red Reference cell signal (cts
s-1).
4. African Monsoon Multidisciplinary Analysis
(AMMA) AMMA-UK represents the first tropospheric
and boundary layer aircraft OH and HO2
measurements over the understudied West African
region. Here a case study of two flights over one
day is presented. Figures 10 13 show OH and
HO2 concentrations for B235A and HO2
concentrations for B235B with Altitude (m) in
Blue.
Figure 3 The Leeds Aircraft FAGE instrument
aboard the BAe-146
2. Calibration Various concentrations of OH and
HO2 are produced by flowing 50 SLM of humidified
air through a square black-anodised aluminium
tube (1.27 cm x 1.27 cm x 130 cm) with SuprasilTM
windows (Figure 4). A mercury pen ray lamp is
mounted over this window in aluminium housing
purged with dry N2. Using N2O as a chemical
actinometer, the actinic flux of the mercury lamp
is determined prior to calibration. To obtain the
range of OH and HO2 required for calibration
(c.a. 2 x 10⁶ - 9 x 10⁸ molecule cm-3), the water
vapour mixing ratio, mercury lamp current and
flow speed can be varied. An example of the OH
and HO2 sensitivites obtained at 2.1 Torr can be
seen in Figure 5.
Table 1 OH and HO2 coverage during the AMMA
Campaign
Figure 6
The altitude range of the BAe-146 produces
internal cell pressures ranging from 1 to 2.5
Torr. Following the assumptions (Faloona et al,
2004) that the losses of OH and HO2 on the
surface of different inlets are small and
constant, the pressure range can be achieved by
using nozzles with different pinhole diameters.
Figure 10 HO2 (molecule cm-3) during B235A
Figure 11 HO2 (molecule cm-3) during B235B
Flights B235 A B were a transect south from
barren soil to highly vegetated area, where high
concentrations of biogenics had been observed on
previous flights. Large variations in OH
concentrations were observed during B235A (Figure
12), while rapid decreases in HO2 concentrations
were observed when sampling in cloud (Figures 10
and 13). This decrease in HO2 was correlated with
increases in liquid water content. In Figure 11
(B235B) HO2 was greatly reduced at night over the
same area.
Figure 4 The calibration set-up
Figure 7
Figure 5
Figure 12 OH (molecule cm-3) (6 minute
integration time) during B235A. All data is above
the instrument limit of detection
Figure 13 HO2 (molecule cm-3) greatly reduced
when sampling in cloud during B235A
(Right) Figure 6 OH Sensitivity with Cell
Pressure Figure 7 HO2 Sensitivity with Cell
Pressure The corresponding aircraft altitude is
also shown. The dashed lines indicate the
pressure range experienced during AMMA.
Figure 5 OH and HO2 Sensitivity at 2
Torr Black OH sensitivity 6.47 x 10⁻⁸ Red
HO2 sensitivity 9.95 x 10⁻⁸ (cts s-1 mW-1
molecule-1 cm3)
Acknowledgements Thanks to University of Leeds
Electronic and Mechanical Workshops, FAAM, Avalon
Engineering, AMMA-UK, AMMA-EU NERC
References Bloss et al (2003) J. Enviro.
Monit., 5 (21-28) Bloss et al (2005) Faraday
Discuss., 130 (1-12), 130/22 Faloona et al
(2004) J. Atmos. Chem., 47, 139-167
Recommended
CrystalGraphics Presentations


