
The Analysis of NMR data - PowerPoint PPT Presentation
1 / 68
Title:
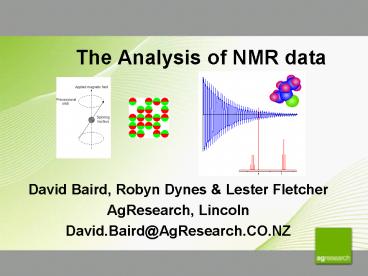
The Analysis of NMR data
Description:
Electrons & protons spin on their axes. In many atoms these spins are ... If energy is absorbed by the nucleus, then the angle of precession, q, will change. ... – PowerPoint PPT presentation
Number of Views:160
Avg rating:5.0/5.0
Title: The Analysis of NMR data
1
The Analysis of NMR data
- David Baird, Robyn Dynes Lester Fletcher
- AgResearch, Lincoln
- David.Baird_at_AgResearch.CO.NZ
2
Nuclear Magnetic Resonance
- Electrons protons spin on their axes
- In many atoms these spins are paired against each
other, but in some there is an overall spin due
to unpaired particles - 1H 13C 15N and 19F are such atoms
- Under a magnetic field the 2 spin directions
represent different energy levels
3
Energy Transitions
- If energy is absorbed by the nucleus, then the
angle of precession, q, will change. For a
nucleus of spin 1/2, absorption of radiation
"flips" the magnetic moment so that it opposes
the applied field (the higher energy state).
4
Energy Gap depends on Field Strength
- The stronger the magnetic field the larger the
energy gap - Thus large superconducting electromagnets used
5
Absorbing EM radiation causes Transition
- EM radiation absorption depends on the wavelength
- Wavelength corresponding to transition energy is
most strongly absorbed - When the spin swaps back the radiation is emitted
6
Boltzmann Distribution
7
Probing the Sample
- The chemical sample may be tested by probing with
constant frequency under a varying magnetic field
8
Probing the Sample
- OR The chemical sample may be tested by probing
with varying frequency/energy under a constant
magnetic field
9
Shielding
- Hydrogen (Protons) main atom used
- Electronegative atoms shield the protons
- Example
10
Shielding
- Height proportional to no of atoms in the state
Spectra
- Shift controlled by surrounding electronegative
atoms
11
Spin-Spin Coupling
- Neighbouring protons feel each others spin
interact, splitting the signal
Doublet
Triplet
12
Energy Gap depend on other protons spins
13
Spin-Spin Coupling
- Number of sub-signals no of neighbouring
protons 1
Triplet
Quartet
14
Signal Splitting
- Oxygen double bond very electronegative signal
far to the right - 6 protons in methyl groups causes 7 splits, each
further split into 2 signals by methine proton - Peak ratios follow Pascals Triangle
15
Shielding Effects
16
Pulse NMR
- Varying Frequency/Magnetic field too slow
- Introduce a very short (2 micro second) pulse of
RF - Equivalent to radiating over a large range of
frequencies - Record the time relaxation to Boltzmann
equilibrium of all bonds over time - Do a Fast Fourier transform in time domain to
recover intensity of different frequencies
17
Fourier Transform
18
Phase Selection
- Signal recorded in X Y axes in NMR (Real and
Imaginary inputs to FFT) - Real Imaginary signals may be rotated
- Intensity read as real part of FFT
19
Phase selection
Real
Imaginary
20
Actual Time Domain Signal
21
Frequency Domain Signal (after FT)
22
Frequency Domain Signal (bad Phasing)
23
Water Peak
- Water is main component of urine
- This peak dominates the spectra
- This peak is reduced in the sample by saturating
the sample with RF of the corresponding
wavelength (quenching) - The water molecules stay in an excited state,
reducing their signal
24
NMR Machines
25
Large NMR Machine
26
NMR Schematic
27
Inside NMR machine
28
Loading Sample
29
Ryegrass Endophyte
Endophyte hyphae growing through ryegrass cells
- Fungi with symbiotic relationship with grasses
- Passed on in the seed
- Gives resistance to insects
- Produces a range of Alkaloid metabolites
- Ergovalines - raise animals body temperature
kills insects - Lolitrems - muscle tremagens
- Peramines Feeding inhibitors
- Concentrates in reproductive tissues
30
Effect of Endophyte on Pasture
Low
High
31
Effect of Endophyte on Animals
- Ryegrass staggers
32
Endophyte Toxicity Experiment
- Aim to create a discriminant function that
indicates sheep have levels of endophyte that
impair their productivity (sub-clinical effects) - Can we detect endophyte in pasture from urine or
blood samples from sheep? - Test urine from sheep in NMR machine to detect
endophyte metabolites - Data NMR spectra from each urine sample
- Complex chemical sample not interested in
identifying differing chemicals, but looking for
consistent differences between spectra
33
Trial Design
- Feed sheep control diet, and then switch to
treated diet - Endophyte fed as contaminated seeds (strongest
concentration) - Alkaloid Ergotamine added to feed
- Sporidesmin another fungal alkaloid which
damages the liver (Facial Eczema) added to feed
known liver metabolites can be detected.
34
Trial Design
Treatment Added to feed
1. Endophytic Seed 2. Ergotamine 3. Sporidesmin
Control Nil
1
5
4
6
3
2
Day
- Some core animals used multiple times at all time
points - Other animals just a pre and post measurement
35
Sources of Variation
- Temperature affects the spectra
- Room kept at constant temperature by may be
variation with time first samples brought to
room may not have equilibrated - Different operators
- Day day variation
- Biological variation
- Fourier Transform Phase selection
36
Data Acquisition
- NMR machine produces
- Paper output of spectra
- HPG graphics file
- Binary file in Mac Format
- Students used a routine that read the curve from
the HPG file (2048 points resolution) - Developed an extension to GenStat IMPORT that
read the binary data in (by disassembling the
binary file!) - Now have full precision 8192 points per sample
- 710 Samples in experiment 50MB of data
37
Randomization of samples
- Animals randomized to added treatments in each
period all have control period. - Samples not randomized in order presented to NMR
machine (oversight due to being processed outside
our control). - Samples done in batches by different operators
- New improved water quenching technique developed
during the analysis period - Did not change to the new technique to avoid
added variation
38
Resulting Spectra
39
Range of peak intensities - Scaling
40
Phase problems with Water peak
Scaled Spectra
41
Baseline Drift Problems
Base line not flat
42
Base Line Adjustment
- Remove linear trend
- Smooth bottom p of points remove from curve to
leave peaks
43
Peak Location
Are the peaks of the three spectra at the same
locations or has the curve shifted?
44
Standardization
- Different levels of intensity across samples
(particularly for water peak) Adjustment to
common scale (90 percentile or median set to
same location) - Phase change differences (base line going below
zero) base line estimation and adjustment - Possible location of peaks at different
locations Single translation or warping
45
Registration
- Small jitter in X for peaks gives
- increase in standard deviation,
- decrease in means ? large decrease in
significance
µ 1 s 0.3
µ 0.3 s 0.5
46
Optimal Translation between 2 spectra
- Can calculate cross-correlations and take maximal
shift
Optimal shift -2
47
Dynamic Warping
- When moving through two series we can at any
point move on 1 in both series or not take a step
in either series - Find the path through both series that minimizes
the mismatch between the 2 series - Can enforce that both series start and finish at
the end if wanted - Algorithm exists to find optimal path in a single
pass
48
Optimal Path Algorithm
Mismatch
Minimum to cell
Path Memory
Backtrack through path memory
Calculate minimum mismatch from 1 stage to next
stage for each cell
49
Warping Penalty
- Add ?(change in row number) to sums of squares
- Minimize penalized sums of squares
- Larger ? induces smoother path (more likely to
move horizontally) - Can scale ? to make penalized sums of squares
more consistent between data sets
50
Optimal For Series Matching
Mismatch
- Movement along 1 1 axis.
- Can enforce starting and ending in a corner
- Need only path memory and final mismatch column
- Penalty for not moving in 1-1 direction
51
Application to NMR data
- GenStat procedure developed for matching
curvesUses DLL for speed and minimizing memory
usage - Path memory requires lots of memory (8192 x 8192
matrix but 2 bytes per unit) - Algorithm still very quick
- What standard to warp to?
- Use any curve first time
- Take average of warped curves and warp to this
- Iterate
52
Warp Path (Deviations from 1-1)
- Three typical paths
- Black Little adjustment
- Red- Pushed right
- Green - Pushed left
53
Endophyte Effect (No adjustment)
Intensity
54
Endophyte Difference
Change in Intensity
55
Endophyte Probabilities
log(Probability)
56
Endophyte Effect (Warped Baseline)
Intensity
Water Peak excluded
57
Endophyte Difference
Change in Intensity
Cleaner/Tighter Spikes
58
Ergotamine Effect
Intensity
59
Ergotamine Effect
Change in Intensity
60
Ergotamine Effect
log(Probability)
61
Sporidesmin Effect (unadjusted)
Intensity
62
Sporidesmin Effect
Change in Intensity
63
Sporidesmin Effect
log(Probability)
64
Sporidesmin Effect (adjusted)
Intensity
65
Sporidesmin Effect
Change in Intensity
66
Sporidesmin Effect
log(Probability)
67
To do
- Integrate peaks to improve precision(Need limits
of peak)
- Discriminant analysis to use multiple peaks in
classification - Look at components of variation
- REML analysis to allow for experimental structure
68
Thanks to conference organizers
Recommended
CrystalGraphics Presentations


