
Well logs electric logs, wireline logs - PowerPoint PPT Presentation
1 / 24
Title:
Well logs electric logs, wireline logs
Description:
Boxcar trend (cylindrical trend): Low gamma, sharp boundaries, no regular internal change ... Boxcar and dirtying-up trends in alluvial succession, Lunde ... – PowerPoint PPT presentation
Number of Views:2962
Avg rating:3.0/5.0
Title: Well logs electric logs, wireline logs
1
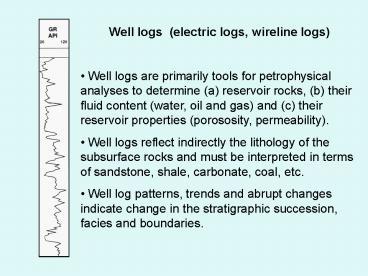
- Well logs (electric logs, wireline logs)
- Well logs are primarily tools for petrophysical
analyses to determine (a) reservoir rocks, (b)
their fluid content (water, oil and gas) and (c)
their reservoir properties (porososity,
permeability). - Well logs reflect indirectly the lithology of
the subsurface rocks and must be interpreted in
terms of sandstone, shale, carbonate, coal, etc. - Well log patterns, trends and abrupt changes
indicate change in the stratigraphic succession,
facies and boundaries.
2
- Well log suites
- Caliper logs borehole diameter
- Gamma-ray logs gamma activity in the wall rock
(formation) - Sonic logs Sonic transit time in the formation
- SP logs Electical potential between wall rock
and a surface standard - Density-neutron logs Electron density/neutron
density - Resistivity logs Electric resistivity in the
formation - Spectral logs Content of special radioactive
elements - Dipmeter and related logs High resolution
resistivity gives orientation of bedding and
cracks
3
- Gamma-ray logs
- Gamma ray activity in the formation rocks is
generally the function of the clay mineral
content (40K). The gamma activity is measured in
API units, a standard from the American Petroleum
Institute - Gamma-ray logs indicate the relative content of
clay and can be applied to infer energy of the
depositional environment with increasing shale
with increasing API values of the gamma-ray
curve, and increasing energy and sand deposition
by decreasing gamma-ray values - High contents of potassium feldspar, U and Th
may give high gamma-ray responses. High gamma-ray
peaks due to 40K, U and Th can be demonstrated by
spectral logs - Upward-cleaning gamma-ray trends are
stratigraphically decreasing trend responses of
the gamma-ray curves - Upward-dirtying gamma-ray trends are
stratigraphically increasing trend responses of
the gamma-ray curves
4
- SP logs
- Spontaneous potential logs measure difference in
electric potential between the formation rock and
the surface (by a standard) - SP is sensitive to changes in permeability and
can be applied to distinguish between permeable
sand and nonpermeable shale - Works best where there is a good resistivity
contrast between the mud filtrate and the
formation water - SP logs usually show a straigt line through
impermable shale units, the shale base line - SP is affected by hydrocarbons, cementation and
changes in formation water salinity - In many cases, SP logs reflect many of the same
features as the gamma-ray curve
5
- Sonic logs
- Measures sonic transit time through the
formation rock, as for example in millisecond pr.
m or foot. This means that high transit time
implies low velocity and vice versa - Sonic logs reflect porosity and lithology
- Shales usually have higher transit times than
sandstones of the same porosity, thus the sonic
logs can be applied as an indicator of grain
size. Note that compacted and cemented mudstone
or shale may have have higher sonic velocity than
associated sandstone, e.g. lower sonic transit
time - High concentration of organic matter as coal and
black shale results in very long sonic transit
times and may be typical for some condensed
intervals - The sonic log is strongly affected by
post-depositional cementation and fracturing and
can be applied to identify such sones, as typical
for some condensed intervals
6
- Density-neutron logs
- The density-neutron suite (the Schlumberger
FDC-CNL log couplet, and similar commercial logs)
is the best indicator of lithology and thus to
decipher depositional trends - The density curve (FDC) measures electron
density from the backscatter of gamma rays send
into the formation rock the density is related
to bulk density. Common range 1.70 to 2.9 (g/cm3) - The neutron curve (CNL) measures the interaction
between neutrons emitted from the tool and
hydrogen atoms in the formation (in water, clays
and hydrocarbons). Common range 0.60 to -0.10 - The density and neutron logs are calibrated to
coincide in clean limestone in sandstone the
neutron curve usually is separated to the right
(lower values) and in shale to the left (higher
values) (cross-overs) - Coals are easily identified by the
density-neutron suite
7
- Resistivity logs
- Resistivity logs measure the bulk electric
resistiviy in the formation rock, which is a
function of porosity and pore fluid - A highly porous rock with saline pore water will
have a low resistivity - A non-porous rock, or a hydrocarbon-bearing
formation, will have high resistivity - Resistivity trends may be excellent lithology
indicators, provided the fluid content is
constant, i.e. in the oil, gas og water legs - Resistivity logs are very good for correlation
within shale successions and within sandstones
with uniform gamma-ray response, as for example
applied in dip-meter logs
8
- Well-log trend patterns
- Cleaning-up trend (funnel trend) gradual upward
decrease in gamma response increasing sand
content - Dirtying-up trend (bell trend) Gradual upward
increase in gamma response increasing clay
content - Boxcar trend (cylindrical trend) Low gamma,
sharp boundaries, no regular internal change - Bow trend (symmetrical trend) Gradual decreas,
then gradual increase in gamma - Irregular trend characteristic trend at all
9
Lowstand Systems Tract (LST) Log response
TRANSGRESSIVE SURFACE TS - -
Consists of a transition from upward shallowing
to upward deepening or an abrupt change in water
depth,
- Characterized
usually by toplap below the TS or below a
transgressive surface of ravinement
(TSR) PROGRADING WEDGE SYSTEMS TRACT (PWST). IF
DEVELOPED, it is characterized by -
Thick intervals of coarsening upward sandstones
near the top,
-
They are made of shoreface and deltaic sands,
occasionally other paralic facies, which prograde
basinward into hemipelagic shale,
-
The PWST pinches out near the offlap break of
underlying HST or early LST LOWER BOUNDARY OF
PWST Reflectors
downlapping on a surface of a
Condensed section
characterized by a maximum clay content and a
faunal abundance peak SLOPE FAN AND BASIN FLOOR
FAN - May be present as upward
coarsening to upward fining successions of
channels,lobes, sheets etc.
Interfingering with and enclosed by hemipelagic
clay-rich mud
GR
TS
Modified from Sangree et al. 1990
10
Transgressive Systems Tract (TST) Log response
MAXIMUM FLOODING SURFACE (MFS)
Presents commonly lowest resistivity and highest
gamma ray response of the sequence
Corresponds to a condensed
section (CS) of starved sedimentation high clay
content, faunal abundance peak and possible
phosphorite and carbonate cementation
Characterized usually by apparent truncation
below the boundary and downlap reflectors above
teh boundary (clinoform geometrt) TST INTERVAL
may be well developed, thin or totally absent. If
TST is present
- Consist of an
overall backstepping (retrogradational)
parasequence set or sets,
- Made of beach and
shorface sandstone towards the base with thin
hemipelagic shale as basin equivalent -
Correlation within TST is good even the
backstepping parasequences are time-transgressive
SEQUENCE BOUNDARY (SB)
Corresponds to an onlap surface formed by
erosion on top of LST deposits, developed as
bottom of an
GR
MFS
SB
11
Highstand systems tracts (HST) Log Response
TRANSGRESSIVE SURFACE (TS)
- May be combined with a sequence boundary
(SB) on top of the HST, formed by fluvial
erosion, whereas the TS is a transgressive
ravinement surface that may have removed all
traces of subaerial exposure
HIGHSTAND SYSTEMS TRACT (HST)
Characterized by an upward-cleaning
trend, or upward coarsening succession, of a
prograding parasequence set consisting of
alluvial plain, coastal plain, shoreline to shelf
facies
The
prograding parasequence set has clinoforms
lapping down onto the maximum flooding surface
MAXIMUM FLOODING SURFACE (MFS)
Commonly coincides with
highest GR log response - Represents a
condensed section rich in fossils covering a
relatively large time interval
May form a
firmground or hardground
TS
CS
12
Well-log suite,Middle Jurassic Brent Group, North
Sea Lithological interpretation
13
Well-log suite,Middle Jurassic Brent Group, North
Sea Sequence stratigraphic interpretation
14
Boxcar and dirtying-up trends in alluvial
succession, Lunde Formation, Upper Triassic,
Snorre Field, North Sea Fluvial channel sandstone
display characteristic boxcar to dirtying-up
trends, confirmed by grain-size trends in cored
intervals
15
Cleaning-up trends in the Ness Formation, Brent
Group, North Sea Individual motifs are
parasequences formed as prograding mouth bars,
interdistributary bay head deltas several capped
by coal beds
16
Upward-cleaning trend, Tarbert Formation, Brent
Group, North Sea The upward-cleaning trend
displayed by the gamma ray curve reflect
increasin sand content of an upward-shallowing
parasequence formed as a prograding shore-face
sand
17
Boxcar trends in Upper Jurassic sandstone
succession, Miller Field,
central North Sea Turbidite sandstone units form
submarine fans or lobes of very small grain size
variation, implying a vertical aggradation of the
deposits, that is a balance between rate of
accommodatio, A, (controlled by the submarine
equlibrium profile) and the rate of
sedimentation, S
18
Bow-log trends in Upper Jurassic submarine
succession, Ettrick Field, central North Sea The
bow log trends indicate upward cleaning
followed by upward dirtying which again suggest
that the sandy depositional units represent
progradational to retrogradational fans or/and
lobes, separated by hemipelagic mudstone
intervals with high gamma-ray response. Note
corresponding trend on all well logs,
particularly gamm-ray and sonic
19
Well log trends and system tract interpretation
in Upper Jurassic sandstone reservoirs of the Ula
Field, central North Sea
20
Well log examples from the Båt and Fangst groups,
Middle Jurassic, Mid-Norwegian shelf The log
suite her consists of the gamma ray, density
(RHOB) and neutron (NPHI), and interval transit
time The formation is defined by the combination
of well core data and the well log responses
Dalland et al. 1988
21
Well log examples from the Tilje, Ror and Ile
formations, Middle Jurassic, Mid-Norwegian
shelf The abrupt shift in log patterns from the
Tilje to the Ror Formation suggests a rapid
flooding and transgression. The mud-dominated Ror
Formation consists of stacked progradational
offshore parasequences ending in the paralic and
tide-influenced sand-rich Ile Formation
Dalland et al. 1988
22
- Bounding surfaces defined in well logs
- Jurassic well 6407/2-1 Type section Ror
Formation - Exercise Find, if possible, candidate surfaces
for - marine flooding surface (FS)
- transgressive surface(TS)
- maximum flooding surface (MFS)
- ravinement surface (RS)
- sequence boundary (SB)
- Define parasequences and parasquence sets, and
make an interpretation of depositional
environment!
Dalland et al. 1988, Fig. 13
23
- Bounding surfaces defined in well logs
- Jurassic well 6506/12-1 Type section
Tofte Formation - Exercise Find, if possible, candidate surfaces
for - marine flooding surface (FS)
- transgressive surface (TS)
- maximum flooding surface (MFS)
- ravinement surface (RS)
- sequence boundary (SB)
- Define parasequences and parasquence sets, and
make an interpretation of depositional
environment!
Dalland et al. 1988, Fig. 11
24
- Bounding surfaces defined in well logs
- Jurassic well 6407/1-3
- Type section Garn Formation
- Reference section Not Formation
- Exercise Find, if possible, candidate surfaces
for - marine flooding surface (FS)
- transgressive surface (TS)
- maximum flooding surface (MFS)
- ravinement surface (RS)
- sequence boundary (SB)
- Define parasequences and parasquence sets, and
make an interpretation of depositional
environment!
Dalland et al. 1988, Fig. 20