
Debra R' Green - PowerPoint PPT Presentation
1 / 28
Title:
Debra R' Green
Description:
... are interested in modifying CITM to simulate Amphibious Assault Operations ... Schedule equipment/vehicle use in unloading cargo from lighters through use of ... – PowerPoint PPT presentation
Number of Views:55
Avg rating:3.0/5.0
Title: Debra R' Green
1
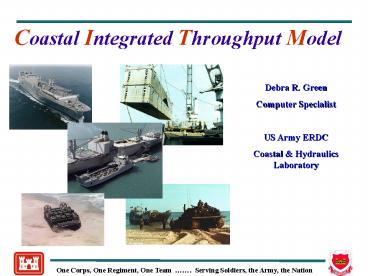
Coastal Integrated Throughput Model
Debra R. Green Computer Specialist US Army
ERDC Coastal Hydraulics Laboratory
Debra R. Green Computer Specialist US Army
ERDC Coastal Hydraulics Laboratory
2
- Features of CITM
- FORTRAN CODE
- PC Based
- Uses data from JLOTS III 91-93 Operations
- Data base can be updated during actual
operations - Allows re-positioning of ships and offload sites
- Incorporates CODES input
- 1 minute time intervals
- Cumulative/recent throughput output
- Includes various environmental data
3
Operations Flow Diagram
9
Approach and Moor
Approach and Moor
1
5
Refueling and Maint.
8
6
2
Load
Unload
Transit
4
Cast-off and Clear
3
Cast-off and Clear
7
4
PURPOSE
- Address current JLOTS simulation needs
- Measure of impact of JLOTS decisions on
- force projection
- Link via PORTSIM to existing
flow models (FPM/AMP) - Tool to evaluate emerging technology (options
study) - Identification of limiting factors to throughput
- Objective site selection
5
- JLOTS is a system of systems
- Very complex
- Very nonlinear
- must account for bottlenecks/problems
- Extremely affected by environmental conditions
- sea state varies day-to-day and year-to-year
- tides and nearshore bars
- must connect to inland throughput capabilities
- Only an objective time-domain tool can provide
accurate answers - CITM provides correct framework for this tool
6
JOINT DEVELOPMENT EFFORT
Argonne National Laboratory
MTMC-TEA
Coastal Hydraulics Laboratory
Geotechnical Laboratory
7
CITM
8
PORTSIM
PORTSIM
PORTSIM
ü
Answers The Following Deployment Centered
Questions
How long does it take a force to move through a
port (port unit
clearance profiles)?
What and where are the bottlenecks within a port?
What part of a port is needed based on the force
moving
through it?
Why are the forces not closed by the required
time and what
are current force locations/status within a port?
What is the measured impact of JLOTS on force
projection and
the DTS?
Due to resource constraints, MTMCTEA has delayed
its work on
the development of CITM.
9
GRAPH THROUGHPUT
PORTSIM GRAPH THROUGHPUT
10
Effect of Sea-State on Throughput
11
Typical CITM Output Showing Prioritized Offload
12
- CITM Version 2
- Will include effect of nearshore bars on bare
beach discharge - Will include beach clearance/beach preparation
module - Will include new lighter types
- Will include random effects
- Will include long term wave climate analysis
- WARSIM/COMBAT XXI developers are interested in
modifying CITM to simulate Amphibious Assault
Operations
13
NEW CITM COMPONENTS
NEARSHORE BATHYMETRY COMPONENT CROSS-BEACH
COMPONENT
14
Effect of Tide and Bathymetry on Lighter Bare
Beach Approach
FRF Profile Data
Elevation (m)
Cross-shore Distance (m)
15
Effect of Tide and Bathymetry on Lighter Bare
Beach Approach
Lighter, Draft 3 ft
FRF Profile Data
Lighter, Draft 3 ft
Lighter, Draft 3 ft
Elevation (m)
Cross-shore Distance (m)
16
Effect of Tide and Bathymetry on Lighter Bare
Beach Approach
Lighter, Draft 5 ft
FRF Profile Data
Lighter, Draft 5 ft
Lighter, Draft 5 ft
Elevation (m)
Cross-shore Distance (m)
17
Effect of Tide and Bathymetry on Lighter Bare
Beach Approach
Lighter, Draft 3 ft
Lighter, Draft 3 ft
FRF Profile Data
Lighter, Draft 3 ft
Elevation (m)
Cross-shore Distance (m)
18
Effect of Tide and Bathymetry on Lighter Bare
Beach Approach
Lighter, Draft 5 ft
Lighter, Draft 5 ft
FRF Profile Data
Lighter, Draft 5 ft
Elevation (m)
Cross-shore Distance (m)
19
Effect of Tide and Nearshore Bars on Throughput
Time Available for Bare Beach Access
Min. Depth for successful CSP Bar Clearance
Water Surface Elevation (m NGVD)
Bar Crest
Time (hrs)
20
Effect of Tide and Nearshore Bars on Throughput
RO/RO Operations for 3 days using CSPs
21
CITM Tests of JLOTS System
- Wish to examine the sensitivity of the overall
JLOTS System to variations in numbers/types of
assets - Wish to identify system bottlenecks
22
LO/LO Operations Results Indicate that JLOTS is A
Balanced System
23
RO/RO Operations Results indicate that Primary
Bottleneck is at the Ship
24
Beach Clearance Module Purpose
- Simulate movement of cargo from beach site to an
inland marshaling area during JLOTS operations - Schedule equipment/vehicle use in unloading
cargo from lighters through use of Container
Transfer System vs.Operation Interoperability
Matrix - Simulate traffic control and identify vehicle
limitations on road surfaces taking into account
the following - Road surface type
- Number of road lanes
- California Bearing Ratio
- Road Capacity (tons/hr)
- Maintenance threshhold
- Simulate cargo unloading at marshaling yard and
placement of cargo into holding areas
25
Update on Beach Clearance Module
- Preliminary Stand-alone Version has been
completed - Incorporation into CITM underway
- Testing for model robustness on sample data has
been performed - Module requires three input files
- Vehicle/Container Transfer System prototype
characteristics - Road network characteristics data with path
nodes for CTS prototypes - Marshalling Yard characteristics
- Module consists of extensive cargo movement
output at specified update intervals
26
Sample of Plotted Output from Beach Clearance
Module
27
Sample of Output from Beach Clearance Module
CURRENT SIMULATION TIME
155.0 Minutes
Vehicle ID (Name) 9 (M1070/M1000/20FT)
Assigned To Site 3 Vehicle Speed
0.00 Current Vehicle State UNLOADING AT
MARSHALING YARD Marshal01 IN Area-A
X Y
------ ------ Current Location
2.00 2.00 Location Heading Toward
2.00 2.00 Site/Marshaling Yard
Location Heading To 2.00 2.00 Surface Type
Vehicle Is On ASPHALT
20-ft containers 40-ft containers RO/RO
----------------
---------------- ----- Site Load
294 199
10 Vehicle Load 2
0 Marshaling Yard Load 9
3 Marshaling Yard Vehicle Capacity
1 Vehicle ID (Name) in MY Waiting Queue Current
Vehicle at Site Load Time 0.0
28
FY01 and Beyond
- Incorporate cross-beach module
- Expanded compatibility with input data
- CITM Ver. 2 is under development for FY 02
completion
29
QUESTION(S)?
Recommended
CrystalGraphics Presentations


