
many most characters affecting fitness are polygenic - PowerPoint PPT Presentation
1 / 30
Title:
many most characters affecting fitness are polygenic
Description:
environmental variation acting on a single gene. W P R. frequency ... environmental variation acting on a single gene - effects of multiple genes ... – PowerPoint PPT presentation
Number of Views:32
Avg rating:3.0/5.0
Title: many most characters affecting fitness are polygenic
1
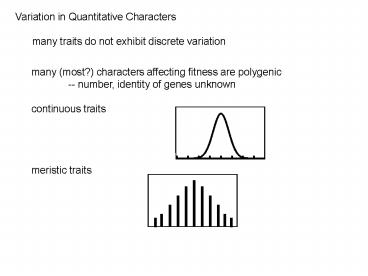
Variation in Quantitative Characters many
traits do not exhibit discrete variation
many (most?) characters affecting fitness are
polygenic -- number, identity of genes
unknown continuous traits meristic
traits
2
continuous variation - environmental
variation acting on a single gene
3
one locus with 2 codominant alleles 3
genotypes 3 phenotypes
frequency
W P R
4
one locus with 2 codominant alleles 3
genotypes 3 phenotypes
frequency
W P R
W P R
5
one locus with 2 codominant alleles 3
genotypes 3 phenotypes
frequency
W P R
pure white
pure red
W P R
environmental variation leads to continuous
phenotypic variation
6
continuous variation - environmental
variation acting on a single gene - effects of
multiple genes
7
5 loci w/ 2 additive alleles each allele
adds red each - adds nothing
environmental variation
frequency
-/- -/- -/- -/- -/-
/ / / / /
8
continuous variation - environmental
variation acting on a single gene - effects of
multiple genes - multiple genes plus
environmental variation
9
5 loci w/ 2 additive alleles each allele
adds red each - adds nothing
environmental variation
frequency
pure red
-/- -/- -/- -/- -/-
pure white
/ / / / /
10
Polygenic traits influenced by genetic
variation at many loci Goals of quantitative
genetics - what proportion of phenotypic
variation is due to genetic variation? - how
do genetic variation and environmental
variation interact to produce the phenotype?
11
Polygenic traits obey the rules of mendelian
inheritance - homozygous individuals
produce one type of gamete - heterozygous
individuals produce gt1 type of gamete but,
because most individuals are heterozygous, crosse
s are uninformative ??????? What can be
measured ?? phenotypic variation
12
describing quantitative (continuous) variation
Var 0
X
frequency
4
Var
X
X
X mean arithmetic average variance
how tightly individuals are distributed
around the mean
F2
13
P G E VP VG VE
analysis of polygenic traits - phenotypic
comparison of close relatives that share a known
proportion of their genes - parents and
offspring - full or half siblings
14
Partitioning phenotypic variance VP VG
VE heritability (h2) proportion of
phenotypic variance that is a result of
underlying genetic variance h2 VG/VP
15
Partitioning phenotypic variance VP VG
VE heritability (h2) proportion of
phenotypic variance that is a result of
underlying genetic variance h2 VG/VP
genetic variance components VA - additive
genetic variance VD - dominance variance VI
- epistatic variance VM - maternal
variance
16
additive genetic variance (VA) consequence of
the average effect of substituting one allele
at a locus for another additive effects of
alleles and loci component of phenotypic
variance that can be inherited by an
individuals offspring narrow-sense
heritability (h2N) proportion of phenotypic
variance due to underlying additive genetic
variance h2N VA/VP
17
Additive variance effect of allelic
substitution A1A1 A1A2 A2A2 if
the phenotype value ranges from 0 1 additive
effects dominance effects 0 0.5 1.0
0 0.5 1.0 A1A1 A1A2
A2A2 A1A1 A2A2 A1A2
-a a
-a a
d
18
in terms of simples crosses A1A2 x
A1A2 ¼ A1A1 ½ A1A2 ¼
A2A2 compare average parental phenotype vs.
average offspring additive 0.5 vs. 0.5
dominance 1.0 vs. 0.75
19
A2A2 x A2A2
A1A2 x A2A2
A1A2 x A1A2
Average Offspring
A1A1 x A1A2
A1A1 x A1A1
Average Parent (MPV)
20
A2A2 x A2A2
A1A1 x A2A2
A1A2 x A1A2
A1A2 x A1A1
Average Offspring
A1A1 x A1A1
Average Parent (MPV)
21
Goals of Quantitative Genetics Experiments
- rear a population of individuals in the
laboratory - allow population to undergo
random mating - rear offspring under the
same environmental conditions as the parent
generation 1. reduce/eliminate environmental
variation (VE and VGXE) 2. statistically
characterize phenotypic distribution in terms
of mean and variance 3. compare the phenotypic
distribution of close relatives (e.g., parents
and offspring) how well can resemblance be
predicted??
22
measuring h2 and additive variance
parent-offspring regression genetic covariance
of parents and offspring 0.5
slope of line b, regression coefficient
narrow-sense heritability, h2
offspring mean
each point one family
MPV parental mean
significance of h2 determined by
significance of regression
23
measuring h2 and additive variance
parent-offspring regression if the
regression is not significant, heritability is
not significantly different from zero (i.e.,
there is none) traits which lack narrow sense
heritability (and additive genetic variance)
cannot be changed effectively by selection
24
h2 0 h2 0.5 h2 1
offspring mean
MPV MPV MPV
h2
25
norm of reaction phenotypic distribution of a
genotype that results from environmental
variation
26
(No Transcript)
27
norm of reaction phenotypic distribution of a
genotype that results from environmental
variation if genotypes at a locus differ in
their norms of reaction, the result is a
genotype x environment interaction
28
(No Transcript)
29
(No Transcript)
30
norm of reaction phenotypic distribution of a
genotype that results from environmental
variation if genotypes at a locus differ in
their norms of reaction, the result is a
genotype x environment interaction heritabi
lity is a property of an environment
Recommended
CrystalGraphics Presentations


