
Data Integrity Issues, Natural Variability and Climate Change - PowerPoint PPT Presentation
1 / 57
Title: Data Integrity Issues, Natural Variability and Climate Change
1
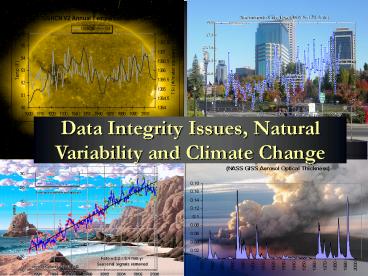
Data Integrity Issues, Natural Variability and
Climate Change
2
Global Climate Change
- Global surface data bases suffer from serious
issues that produce a warm bias and render them
useless for an accurate trend analysis - Temperatures have begun to decline, and are
negatively correlated with CO2 - Oceans and sun cycles and volcanism correlate far
better with temperatures including the recent
cooling
3
Global Data Base Issues
- Station dropout (gt2/3rds since 1990) especially
rural - Missing monthly data increased tenfold after 1990
- Urban adjustment not used or totally inadequate
even as world population increased 1.5 to 6.7
billion since 1900 - Siting for vast majority of observing sites does
not meet WMO or NOAA standards with significant
warm biases - HO83 had warm bias not corrected for. ASOS
instruments designed by FAA for aviation not
climate - Manual or black box adjustments are made with no
visibility for quality control or validation - Oceans cover 70 of the globe and data bases have
major data gaps and questions about how much and
when to adjust for changing measurement
techniques - How can we ever hope to detect trends to
- a precision of a tenth of a degree?
4
Station Dropout and Global Temps
A discontinuity in both at the same time
6000 5000 4000 3000 2000
Most were rural stations
Deg C
5
Jonathan Drake, using GHCN
6
Suggesting a distribution issue
Jonathan Drake, using GHCN
7
(No Transcript)
8
(No Transcript)
9
Number of Missing Months
For the 110 Russian weather stations reporting
weather data continuously from 1971 to 2001, the
total number of missing monthly observations each
year (McKitrick and Michaels)
10
SVERDLOVSK, RUSSIA
11
Urban Heat Island Effect
- In cities, vertical walls, steel and concrete
absorb the suns heat and are slow to cool at
night. More and more of the world is urbanized.
Cities grow around airports where we measure
temperatures - Peer review suggests adjustment is necessary.
- Oke (1973) showed even towns can have warming
(town of 1000 2C or 3F) especially in winter - Zhou et al (2005) have shown global data bases
(for China) not properly adjusted for
urbanization. Block (2004) showed the same
problem exists in central Europe. - Hinkel et al (2003) showed even the village of
Barrow, Alaska with a population of 4600 has
shown a warming of 2.2C (3.4F) in winter over
surrounding rural areas - Insufficient adjustments introduces a warm bias
in data
12
Goodridge 1996
Counties in CA with gt1 million Population 4F
Counties in CA with between 100,000 and 1
million population 1F Counties in CA with less
than 100,000 Population 0F
13
Data Centers and UHI
- NCDC has removed UHI adjustment (Karl 1988) from
USHCN in version 2 (2007) - NOAA GHCN and Hadley CRUT3v dont specifically
adjust for UHI which requires metadata (siting,
population, etc) they dont have. Instead they
apply a 0.05-0.1C uncertainty per century to the
data - GISS applied a satellite light based UHI
adjustment to USHCN and attempts a global UHI
adjustment but without good population data,
McIntyre finds their adjustments for global urban
areas are as often up as down
14
USHCN Change Point Algorithm
- NOAAs NCDC replaced the USHCN urban adjustment
with a Change Point Algorithms designed to detect
previously undocumented inhomogenieties. - It is better suited to detect sudden
discontinuities signifying changes like station
moves or large local land use changes - It cant be expected to find the slow ramp of
temperature associated with urban growth or of
the gradual land use changes identified by
Runnals and Oke (2006).
15
Tahoe City, CA Tennis court added in early 1980s
16
Sacramento urban growth and warming will not be
seen
17
Suggests NOAA algorithm does not work and
thatUHI is SIGNIFICANT
0.75F
Proof of man-made global warming but the men are
in Asheville
18
Widespread Siting Issues Shown
19
(No Transcript)
20
(No Transcript)
21
Only 11 of the stations meet standards
22
(No Transcript)
23
Contamination of the Data Bases
- Numerour peer-reviewed papers ignored by the IPCC
and the data centers have estimated that these
problems with the observing networks may account
for up to one half the warming since 1880 (Kalney
and Cai, de laat and Maurellis, Pielke and Davey,
Pielke et al (numerous), Lin and Pielke, Michaels
and Balling, Michaels and McKitrick, Runnals and
Oke)
24
NASA GISS US DATA
Even with the errors, not much real warming
0.18F
How good is it ?
25
Lampasas, TX moved from a park like area to
this street-side location in 2000
So called NASA homogeneity adjustment cooled
off the early 1900s but did not adjust for this
obvious change. The result - a larger
warming trend when a cooling trend was underway.
26
Daily Record Highs in June and July Des Moines,
Iowa
27
(No Transcript)
28
6.5 5.5 4.5 3.5 2.5 1.5
0.25C/0.45F
World Population (Billions)
WORLD
NO UHI ADJUSTMENT
29
(No Transcript)
30
5 of the last 7 decades have seen cooling since
WWII in the post war boom US
5 of the last 7 decades temperatures have fallen
as CO2 rose!
31
Hadley CRUT3v Temp Anomaly r - 0.44
Mauna Loa Seasonally Adjusted CO2 - ESRL
UAH MSU Lower Trop Temp Anomaly r - 0.35
32
Natural Climate Drivers
- Ocean cycles - annual and decadal
- Solar cycles longer term
- Volcanism
33
UKMO and ENSO, NASA and PDO
- Prof. Chris Folland (Jan 2008) from the Met
Office Hadley Centre said "Phenomena such as El
Niño and La Niña have a significant influence on
global surface temperature - Hansen in 1999 said We suggest that further
warming in the United States to a level rivaling
the 1930s is likely in the next decade, but
reliable prediction requires better understanding
of decadal oscillations of ocean temperature.
http//pubs.giss.nasa.gov/docs/1999/1999_Hansen_et
al.pdf
34
LA NINA
EL NINO
COLD WARM
COLD
WARM
35
ENSO and the Pacific Decadal Oscillation
36
cold
warm
37
COLD WARM COLD WARM
ltimg src"filedir_1PDO_AK_thumb.jpg"
style"border 0" alt"image" width"200"
height"150" /gt
38
PDO - COLD MODE PDO WARM MODE COLD
Mostly El Ninos
Mostly La Ninas
Wolter
39
R 0.74
40
Atlantic MultiDecadal Oscillation
41
NOAA CDC
Mean ocean temperature anomalies in the Atlantic
from 0 to 70N
42
Atlantic Multidecadal Oscillation
Correlates with northern hemisphere warmth,
statistically significant in places
Tripole like the PDO
43
(No Transcript)
44
Major Volcanic Eruptions
45
( a measure of level of sulfate aerosols)
(NASA GISS)
Cooling events then recent warming from
variations in volcanic activity
What about these extensive global cooling events
46
Years with more than ½ STD departures
stratospheric aerosols
More than 1/2 STD Above
More than ½ STD Below
January to December Annual Temperature Anomalies
Data NASA GISS, CDC
Last 8-10 years
After major eruptions During quiet periods
47
SOLAR SUNSPOT CYCLES
1950 1960 1970 1980
1990 2000
48
Grand Maximum
Grand Maximum
Dalton Minimum
Dalton Minimum
Quieter cycle periods
49
Cyclical Factors - Solar
- Direct Effects
- Changes in solar brightness (irradiance)
(Baliunas, Soon, Hoyt, Schatten, Scafetta/West) - Indirect Effects
- UV (which changes 6-8 in 11 year cycle) warming
through ozone chemistry high up in low and mid
latitudes (Labitzke , Shindell at NASA GISS) - Active sun reduces low cloudiness by diffusing
galactic cloud forming cosmic rays (Svensmark) - Scaffetta and West (2007) using Total Solar
irradiance as a proxy for the total solar effect
suggested the sun may account for 69 of the
changes since 1900
50
NCDC Annual Mean US Temperature vs Hoyt Schatten
TSI
TSI as a proxy for total solar effect
R2 0.59 R2 0.64 for 3 year lag temp vs TSI
51
CYCLES
SUN AND OCEAN CYCLES
Annual Averages from 1900-2008
TSI
PDOAMO
52
Ocean PDOAMO
US Annual Temps
Solar TSI
53
A total of over 564 so far this transition 23 to
24
54
(No Transcript)
55
Solar Length vs T (Friis Christensen)
No, it is evidence the global data bases are
contaminated
- During the latest about 20 years, temperature has
increased more than expected -based on the length
of the solar cycle - The effect of enhanced greenhouse effect is
finally seen - The climatic effect of solar activity is not
fully described by the length of the solar cycle
56
(Cliverd et al., 2007)
Dalton Minimum
57
Summary
- Temperature trends are exaggerated by many issues
most notably urbanization and siting. Warming in
recent decades smaller than assumed and are of a
cyclical nature - Natural cycles in the ocean and on the sun
correlate far better with temperatures than CO2 - The quiet sun and ocean cooling suggest cooling
not warming in our future