
Continuous Probability Distributions - PowerPoint PPT Presentation
Title:
Continuous Probability Distributions
Description:
Chi-Squared. Lognormal. Weibull. Statistical Review for Chapters 3 and 4 ... A certain machine makes electrical resistors having a mean resistance of 40 ohms ... – PowerPoint PPT presentation
Number of Views:15
Avg rating:3.0/5.0
Title: Continuous Probability Distributions
1
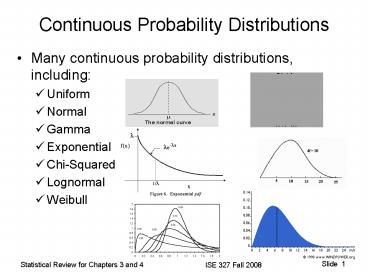
Continuous Probability Distributions
- Many continuous probability distributions,
including - Uniform
- Normal
- Gamma
- Exponential
- Chi-Squared
- Lognormal
- Weibull
2
Normal Distribution
- The bell-shaped curve
- Also called the Gaussian distribution
- The most widely used distribution in statistical
analysis - forms the basis for most of the parametric tests
well perform later in this course. - describes or approximates most phenomena in
nature, industry, or research - Random variables (X) following this distribution
are called normal random variables. - the parameters of the normal distribution are µ
and s (sometimes µ and s2.)
3
Normal Distribution
- The density function of the normal random
variable X, with mean µ and variance s2, is - all x.
4
Standard Normal RV
- Note the probability of X taking on any value
between x1 and x2 is given by - To ease calculations, we define a normal random
variable - where Z is normally distributed with µ 0 and
s2 1
5
Standard Normal Distribution
- Table A.1 Areas under the standard normal
curve from - 8 to z - Page 915 negative values for z
- Page 916 positive values for z
6
Examples
- P(Z 1)
- P(Z -1)
- P(-0.45 Z 0.36)
7
Your turn
- Use Table A.1 to determine (draw the picture!)
- 1. P(Z 0.8)
- 2. P(Z 1.96)
- 3. P(-0.25 Z 0.15)
- 4. P(Z -2.0 or Z 2.0)
8
Applications of the Normal Distribution
- A certain machine makes electrical resistors
having a mean resistance of 40 ohms and a
standard deviation of 2 ohms. What percentage of
the resistors will have a resistance less than 44
ohms? - Solution X is normally distributed with µ 40
and s 2 and x 44 - P(Xlt44) P(Zlt 2.0) 0.9772
- Therefore, we conclude that 97.72 will have
a resistance less than 44 ohms. What
percentage will have a resistance greater than 44
ohms?
9
Terminology Used in ISE 327 Text
- A certain machine makes electrical resistors
having a mean resistance of 40 ohms and a
standard deviation of 2 ohms. What percentage of
the resistors will have a resistance greater than
44 ohms? - Solution X is normally distributed with µ x
40 and sx 2 and x 44 - P(Xgt44) 1 - P(Zlt 2.0) 1 - 0.9772
- Therefore, we conclude that 2.28 will have
a resistance greater than 44 ohms.
10
Your Turn
DRAW THE PICTURE!!
- What is the probability that a single resistor
will have a rating between 42 and 44 ohms? - Specifications are that the resistors are 40 3
ohms. What percentage of the resistors will be
within specifications?
11
The Normal Distribution In Reverse
- Example
- Given a normal distribution with µ 40 and s
6, find the value of X for which 45 of the area
under the normal curve is to the left of X. - If P(Z lt k) 0.45,
- k ___________
- Z _______
- X _________