
Reference - PowerPoint PPT Presentation
1 / 1
Title: Reference
1
Interpretation of MOPITT-measured Carbon Monoxide
Distribution In The Troposphere
Jiansheng Zou, Jane Liu, Florian Nichitiu, Holger
Bremer and James R. Drummond Department of
Physics, University of Toronto, 60 St. George
Street, Toronto, Ontario, Canada M5S 1A7
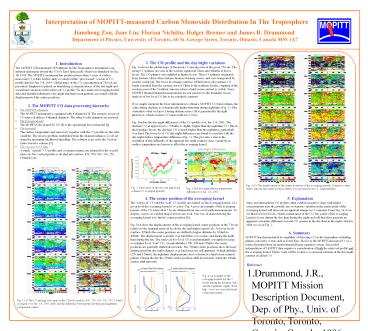
3. The CO profile and the day/night
variation Fig. 1a shows the global maps of the
mean CO mixing ratio at the given 7 levels. The
strong CO plumes are seen in the western
equatorial Africa and Atlantic at lower levels.
The CO plumes were uplifted to higher levels.
These CO plumes originated from Eastern Africa
where intense biomass burning occurs, and were
transported by easterly winds 4. The lower
level maps (surface, 850mb) show also intense CO
bands extended from the eastern coast of China to
the northern Pacific, stopping at the western
coast of the Northern America where a land/ocean
contrast is visible. Since MOPITT thermal channel
measurements are not sensitive to the boundary
layers, analysis of low level CO has to be
extremely cautious. If we simply integrate the
layer information to obtain a MOPITT CO total
column, the value during daytime is
systematically higher than that during nighttime
(Fig. 2). This contradicts what we know. During
daytime more OH is generated by the light
photolysis, which oxidizes CO and results in CO
loss. Fig. 1b plots the day/night differences of
the CO profile over Jan. 1-8, 2001. The daytime
CO in upper layers (lt500mb) is slightly higher
than the nighttime CO. But in the boundary
layers, the daytime CO is much higher than the
nighttime, particularly over land. The lower
level CO day/night differences are found to
correlate with the day/night surface temperature
difference (Fig. 3). This provides a clue to the
resolution of this difficulty of the apparent
day/night contrast, since variations in surface
temperature are known to affect the averaging
kernel.
1. Introduction The MOPITT (Measurement Of
Pollutions In The Troposphere) instrument is an
infrared radiometer aboard the NASA Terra
Spacecraft, which was launched on Dec. 18, 1999.
The MOPITT instrument has produced more than 3
years of carbon monoxide (CO) data. In this study
we analyzed the provisional version of CO
profile data for Jan. 1-8, 2001. Global maps of
the CO concentration at 7 levels are presented.
Emphasis is placed on identifying systematic
biases of the day/night and ocean/land variations
in the retrieved CO profile. We also analyzed
averaging kernel data and identified distinctive
day/night and land/ocean patterns associated with
the displacement of the center positions.
- 2. The MOPITT CO data processing hierarchy
- The MOPITT channelsThe MOPITT instrument is
equipped with 8 channels 1. The current version
of CO retrieval utilizes 4 thermal channels. The
other 4 solar channels are not used. - The forward modelThe MOPFAS developed by NCAR is
the operational forward model 2. - The retrievalThe surface temperature and
emissivity together with the CO profile are the
state variables. The inverse problem established
from the channel radiances is solved using the
maximum likelihood algorithm. The solution is
given by the Newton-Gauss iterative scheme 3. - The version 3 CO dataA single a priori CO
profile and covariance matrix are adopted for the
overall retrieval. The vertical profile is
divided into surface, 850, 700, 500, 350, 250,
150mb levels.
Fig. 5a, b The displacement of the center
positions of the averaging kernels. Negative
values (blue) indicate the center position shift
to low pressure levels,i.e., high altitudes.
Fig. 2 Time series of the day and night total
column CO averaged globally.
Fig. 3 The day/night surface temperature
difference for Jan. 1-8, 2001.
4. The center position of the averaging
kernel The retrieved CO and the real CO
profile are related via the averaging kernel. At
a given level the averaging kernel is a vector.
Fig. 4 gives an example of the averaging kernels
of the CO retrieval at 7 levels obtained from one
set of earth measurements. To display vectors on
a global map is not an easy task. One way of
characterizing the averaging kernel is to find
its center position 5. Fig. 5a,b show the
displacements of the averaging kernel center
positions at the 7 levels relative to the nominal
retrieval levels for day and night respectively.
At lower levels (surface, 850mb) the center
positions are shifted to higher altitudes by
100mb to 400mb. The displacement is greater over
land than over oceans, and during the night than
during the day. The retrieved low level CO is
predominantly a weighted average over higher
level real CO. At mid-altitudes (700, 500 and
350mb), the center positions are generally
shifted downwards. The 700mb center positions
show the least displacement but day/night changes
over land areas are still apparent. At high
altitudes (250 and 150mb), the nighttime
displacements show a distinctive land/ocean
contrast pattern. During the day the 250mb center
positions shift downwards, while the 150mb
centers shift upwards.
5. Explanation Since real atmospheric CO profiles
often exhibit a negative slope with higher
concentrations near the ground, any systematic
variation in the center point of the averaging
kernel will alias into an apparent change in CO
amount. From Fig. 5a, b we see that for lower
levels, which contain most of the CO, the center
of the averaging kernel is lower during the day
than during the night and will therefore generate
an apparent systematic difference in total CO,
greater in the day than in the night, which is
what we see in Fig. 2.
6. Summary MOPITT has demonstrated its capability
of detecting CO in the troposphere including
plumes caused by events such as forest fires.
However the MOPITT-measured CO is a retrieval
product from an underestimated linear equation
system. Successful interpretation of MOPITT data
requires a consideration of both the retrieved
profile and the averaging kernel. Future work
will be to derive a corrected estimate of the
day/night contrast of global CO.
- Reference
- Drummond, J.R., MOPITT Mission Description
Document, Dep. of Phy., Univ. of Toronto,
Toronto, Ontario, Canada, 1996. - Edwards, D.P., C. Halvorson, and J.C. Gille,
Radiative transfer modeling for the EOS Terra
Satellite Measurement of Pollution in the
Troposphere (MOPITT) instrument, J. Geophys.
Res., 104, 16,755-16,775, 1999. - Pan, L., J.C. Gille, D.P. Edwards, P.L. Bailey,
and C.D. Rodgers, Retrieval of tropospheric
carbon monoxide for the MOPITT experiment, J.
Geophys. Res., 103, 32,277-32,723, 1998. - Edwards, D.P., J.-F. Lamarque, J.-L. Attie, L.K.
Emmons, A. Richter, J.-P. Cammas, J.C. Gill, G.L.
Francis, M.N. Deeter, J.Warner, D.C. Ziskin, L.V.
Lyjak, J.R. Drummond, and Burrows, Tropospheric
ozone over the tropical Atlantic A satellite
perspective, J.Geophys. Res., 108, 2003 (in
press) . - Conrath, B., Vertical resolution of temperature
profiles obtained from remote radiative
measurements, J. Atmosp. Sci., Vol. 29,
1262-1271, 1972.
Fig. 4 An example of the averaging kernels for
the 7 levels during the daytime (left) and the
nighttime (right) (from http//www.eos.ucar.edu/mo
pitt/data/index.html).
Fig. 1a, b The CO mixing ratio maps at the 7
levels (surface, 850, 750, 500, 350, 250, 150mb)
averaged over Jan. 1-8, 2001 (left) and the
difference between the daytime and nighttime
components (right).
Recommended
CrystalGraphics Presentations


