
Obesity Trends Among U'S' Adults BRFSS, 1985 - PowerPoint PPT Presentation
1 / 99
Title: Obesity Trends Among U'S' Adults BRFSS, 1985
1
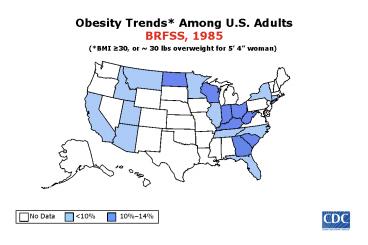
Obesity Trends Among U.S. AdultsBRFSS, 1985
(BMI 30, or 30 lbs overweight for 5 4 woman)
2
Obesity Trends Among U.S. AdultsBRFSS, 1986
(BMI 30, or 30 lbs overweight for 5 4 woman)
3
Obesity Trends Among U.S. AdultsBRFSS, 1987
(BMI 30, or 30 lbs overweight for 5 4 woman)
4
Obesity Trends Among U.S. AdultsBRFSS, 1988
(BMI 30, or 30 lbs overweight for 5 4 woman)
5
Obesity Trends Among U.S. AdultsBRFSS, 1989
(BMI 30, or 30 lbs overweight for 5 4 woman)
6
Obesity Trends Among U.S. AdultsBRFSS, 1990
(BMI 30, or 30 lbs overweight for 5 4 woman)
7
Obesity Trends Among U.S. AdultsBRFSS, 1991
(BMI 30, or 30 lbs overweight for 5 4 woman)
8
Obesity Trends Among U.S. AdultsBRFSS, 1992
(BMI 30, or 30 lbs overweight for 5 4 woman)
9
Obesity Trends Among U.S. AdultsBRFSS, 1993
(BMI 30, or 30 lbs overweight for 5 4 woman)
10
Obesity Trends Among U.S. AdultsBRFSS, 1994
(BMI 30, or 30 lbs overweight for 5 4 woman)
11
Obesity Trends Among U.S. AdultsBRFSS, 1995
(BMI 30, or 30 lbs overweight for 5 4 woman)
12
Obesity Trends Among U.S. AdultsBRFSS, 1996
(BMI 30, or 30 lbs overweight for 5 4 woman)
13
Obesity Trends Among U.S. AdultsBRFSS, 1997
(BMI 30, or 30 lbs overweight for 5 4 woman)
14
Obesity Trends Among U.S. AdultsBRFSS, 1998
(BMI 30, or 30 lbs overweight for 5 4 woman)
15
Obesity Trends Among U.S. AdultsBRFSS, 1999
(BMI 30, or 30 lbs overweight for 5 4 woman)
16
Obesity Trends Among U.S. AdultsBRFSS, 2000
(BMI 30, or 30 lbs overweight for 5 4 woman)
17
Obesity Trends Among U.S. AdultsBRFSS, 2001
(BMI 30, or 30 lbs overweight for 5 4 woman)
No Data lt10 1014
1519 2024 25
18
Obesity Trends Among U.S. AdultsBRFSS, 2002
(BMI 30, or 30 lbs overweight for 5 4 woman)
(BMI ?30, or 30 lbs overweight for 54 person)
No Data lt10 1014
1519 2024 25
Source Behavioral Risk Factor Surveillance
System, CDC
19
Obesity Trends Among U.S. AdultsBRFSS, 2003
(BMI 30, or 30 lbs overweight for 5 4
person)
No Data lt10 1014
1519 2024 25
20
History of Weight Control
21
History of Weight Control
22
History of Weight Control
23
Percent of adults who are overweight or obese
24
Percent of adults who are overweight or obese
65
2/3 of adults are overweight or obese
25
(No Transcript)
26
Excess Body Weight and Reduction of Lifespan
-3.1
-3.3
-5.8
-7.1
Ann Intern Med. 200313824-32
27
Body Fat and Risk
Risk
Body Mass Index
28
Diabetes Among Adults in the U.S.,BRFSS 1990
Source Mokdad et al., Diabetes Care
2000231278-83.
29
Diabetes Among Adults in the U.S.,BRFSS 1991-92
Source Mokdad et al., Diabetes Care
2000231278-83.
30
Diabetes Among Adults in the U.S.,BRFSS 1993-94
Source Mokdad et al., Diabetes Care
2000231278-83.
31
Diabetes Among Adults in the U.S.,BRFSS 1995-96
Source Mokdad et al., Diabetes Care
2000231278-83.
32
Diabetes Among Adults in the U.S.,BRFSS 1995
Source Mokdad et al., Diabetes Care
2000231278-83.
33
Diabetes Among Adults in the U.S.,BRFSS 1997-98
Source Mokdad et al., Diabetes Care
2000231278-83.
34
Diabetes Among Adults in the U.S.,BRFSS 1999
Source Mokdad et al., Diabetes Care 200124412.
35
Diabetes Among Adults in the U.S.,BRFSS 2000
Source Mokdad et al., J Am Med Assoc 200128610.
36
Diabetes Among Adults in the U.S.,BRFSS 2001
Source Mokdad et al., J Am Med Assoc 200128610.
37
Lifetime Risk of Diabetes for Children Born in
2000
Venkat Narayan, JAMA 20032901884
38
Diabetes and Reduction in Lifespan
-14.3 yrs
-11.6 yrs
JAMA 20032901884-1890
39
Diabetes and Reduction in Quality Adjusted Life
Years
-18.6 yrs
-22.0 yrs
JAMA 20032901884-1890
40
Life Expectancy in the U.S.
2-5 year decline in life expectancy
41
Lifetime Risk for Chronic Diseases
NCI Canada, 2.0 Lancet 199935389
42
(No Transcript)
43
How People Died in 2003
Cancer 24
Accidents Suicide Infections Kidney failure Lung
failure Others 40
Cardiovascular Disease 36
44
How People Died in 2003
CVD
Cancer
Other
Up to 70 of all causes of death are lifestyle
related and preventable
The Culprit and The Cure, 2005
45
National prevalence of lifestyle related health
risks
CDC, BRFSS, 2002
46
Percent of Selected Chronic Diseases That Are
Likely Avoidable
91
82
71
70
Sources Stampfer, 2000 Platz, 2000 Hu, 2001
47
How did we get this way?
48
(No Transcript)
49
5-a-day 1 million
Food Marketing 25 Billion
50
(No Transcript)
51
(No Transcript)
52
(No Transcript)
53
(No Transcript)
54
(No Transcript)
55
Advertising
56
(No Transcript)
57
Type of Fat and Risk of Coronary Heart Disease
CVD risk
Hu, New Eng J Med1997
58
(No Transcript)
59
(No Transcript)
60
Lung cancer and vegetable intake
Relative risk
Vegetable intake grams/day
Am Inst for Cancer Research, 1997
61
Stomach cancer and vegetable intake
Relative risk
Vegetable intake grams/day
Am Inst for Cancer Research, 1997
62
Stomach cancer and fruit intake
Relative risk
Fruit intake grams/day
Am Inst for Cancer Research, 1997
63
(No Transcript)
64
(No Transcript)
65
(No Transcript)
66
(No Transcript)
67
(No Transcript)
68
Unpaired Electrons
69
- Free radicals can
- Disrupt or destroy cells
- Damage DNA, lipid membranes, mitochondria, and
proteins - Disrupt vital functions
70
(No Transcript)
71
- DNA in each cell gets a hit from a free radical
every 10 seconds - Each cell gets 10,000 hits/day
72
Cancer deaths by age, in 2001
80 of all cancers occur after age 55
73
Where do free radicals come from?
- Most are produced by our own bodies by the
electron transport system (ETC) - UV light
- burned food
- toxic chemicals
- Industrial
- automobile pollution
- unknown sources
74
Cigarette Smoke
- One puff of smoke contains
- 100,000,000,000,000,000
- free radical species
- Tobacco is responsible for 31 of all cancers
75
Cancer death and smoking
Relative risk
Number of cigarettes/day
76
If you are a smoker
-14.5 yrs
-13.2 yrs
MMWR 199746444-51
77
How do we protect our selves?
78
Phytochemicals
- Carotenoids
- Beta-carotene
- Lycopene
- Lutein
- Zeaxanthin
- Organosulfurs
- Flavinoids
- Phytosterols
- Alkaloids
- Tannins
- Saponins
- 100,000 more we have yet to identify
79
Our Current (Western) Lifestyle
- Little Physical Activity
- Red meat
- Processed meat
- Butter
- Potatoes
- Refined grains
- High fat dairy foods
80
(No Transcript)
81
Adopt and Maintain A Healthy Lifestyle
- Learn Why lifestyle is important
- Learn What a healthy lifestyle is
- Learn How to maintain good behaviors for life
82
(No Transcript)
83
Difference in Years of Life Between High and Low
Health Risk
Frazier, Arch Intern Med. 20011611645
84
Low vs High Health Risks and Life Expectancy
(cumulative)
Age
Frazier et al,Arch Intern Med. 20011611645
85
Real and Possible Changes in Life Span (7th Day
Adventists)
?
?
Fraser et al. Arch Intern Med, 20011611645-1652
86
Real and Possible Changes in Life Span (Mormon
High Priests and wives)
?
?
Mormon High Priests and Wives, Enstrom, UCLA, 1989
87
What Can I Expect if I Reduce My Health Risks?
10 to 20 years of extended, high-quality living
88
And
- Improved quality of life
- Reduced Chronic Disease
- Less medications
- Less Hospital time
- Fewer Surgical procedures
- Postponed disability (Compression of Morbidity)
89
(No Transcript)
90
Compression of Morbidity
Morbidity
Lifespan in years
76
0
Chronic disability
Ann Intern Med, 2003139455-459
91
Compression of Morbidity
Morbidity
Lifespan in years
0
?
76
86
Chronic disability
92
Reductions of Near Death Morbidity
Morbidity
Lifespan in years
Morbidity
Lifespan in years
93
With a Healthy Lifestyle
- Life span can increase
- Chronic disability can be delayed from 7-12 years
- The amount of near death morbidity is reduced by
75 - Health care costs are also dramatically reduced
94
(No Transcript)
95
(No Transcript)
96
(No Transcript)
97
(No Transcript)
98
(No Transcript)
99
Randomized Results
www.culpritandcure.com
Recommended
CrystalGraphics Presentations


