
Chapter 6: Printed Circuit Board Design - PowerPoint PPT Presentation
1 / 71
Title:
Chapter 6: Printed Circuit Board Design
Description:
The course material was developed in INSIGTH II, a project sponsored by the ... for Photo- or Laser Plotter for Making Photographic Films and Printing Masks ... – PowerPoint PPT presentation
Number of Views:342
Avg rating:3.0/5.0
Title: Chapter 6: Printed Circuit Board Design
1
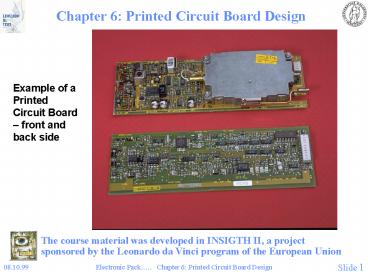
Chapter 6 Printed Circuit Board Design
- Example of a Printed Circuit Board front and
back side
The course material was developed in INSIGTH II,
a project sponsored by the Leonardo da Vinci
program of the European Union
2
PCB Design, Introduction
- For new electronic products, designers are key
persons, but should work in intimate cooperation
with - Sales, marketing and customers
- Subcontractors
- Production process experts
- Cost engineers
- Logistics and purchasing staff
- etc.
3
PCB Design, continued
- Advanced PCB CAD tools a neccessity
- Schematics
- Component Library
- Critical Parameters (Placement Constraints,
Electromagnetic Compatibility, Thermal
Limitations, etc) - Automatic Routing
- Final Touch Manual Routing
- (Verification by Final Simulation and Back
Annotation)
4
PCB CAD tools, continued
- Output
- Final Schematics
- Assembly Drawings
- Documentation for PWB Manufacturer (Gerber file
giving input for making PWB Manucturing Data (See
Chapter 5) - Data for Photo- or Laser Plotter for Making
Photographic Films and Printing Masks - Data for Numeric Drilling and Milling Machines
- Data for Placement Machines
- Data for Test Fixtures and Testing Machines
5
PCB Design, continued
- Guidelines for Right Quality
- Choice of Best Suited Technology/Technologies
- Choice of Components Right Compromise between
Performance, Reliability, Cost, etc. - Design for Production
- Design for Testability
- Design for Repair
6
PCB Design, continued
- Guidelines on Design for Manufacture
- Few layers
- Coarse pattern
- Standardisation
- Robust design (coarse tolerances)
- Orderly placement
Fig. 6.1.a Proper component placement for hole-
and surface mounted components
7
Orderly Placement, continued
- Fig. 6.1.b Proper component placement for hole-
and surface mounted IC components
8
PCB Design, continued
- Important Guideline for "Robust Design"
- Circuits should function with large parameter
tolerances - Design windows allowing for variations in
component parameters. - Process windows allowing for variations in each
process step. - Regulatory requirements on safety and EMC should
be passed within the specified design and process
windows.
9
Design of Hole and Surface Mounted PCBs Design
Parameters
- Minimum Dimensions
- The conductor cross section areas and resistivity
of the material determine maximum current
capacity and thereby minimum dimensions. - Current capacity is limited by excessive heating
of the conductors and the PCB. - Maximum allowed ohmic voltage drop along the
conductor also determines minimum dimensions.
10
Design Parameters Minimum Dimensions
- Fig. 6.2 Current capacity and temperature
increase in conductors on PCBs.The upper figure
shows the temperature increase (labels on each
curve) at different combinations of
cross-sections and currents). The lower figure
shows the conductor cross-section (along the
x-axis) as a function of the conductor width for
different Cu-layer thicknesses.
11
Design Parameters DC Line Resistance
- DC Line resistanceR r L/(t b) r 2 .0
10 -8 Wm for Cu foil - r is resistivity of the conductor material (ohm
m) - L is conductor length
- t is conductor thickness
- b is conductor width
- Sheet Resistance ohm/square
- Rsq r / t
- R Rsq L / b
- 18 um copper Rsq 1 mW/sq
- 35 um copper Rsq 0.5 mW/sq
L
b
t
Current I
L
r/
R R
R
t
b
12
Hole and Surface Mounted PCB Design
- Pattern Minimum Dimensions
Table 6.1 Examples of minimum dimension and PCB
classes. The class indicates how many conductors
can pass between the solder pads of a DIP package
(no. of channels), and typical corresponding
minimum dimensions in mm. When two figures are
given for hole diameters, they are for component-
and via holes respectively.
13
Pattern Minimum Dimensions,continued
a)
b)
- Fig. 6.4 a) Parameters in layout dimensions
used in Table 6.1. b) Minimum dimensions for
solder mask for surface mount PWBs. Left
Dimensions for screen printed solder mask, with
one common opening for all solder lands of an IC
package. Right Photoprocessible solder mask with
a "pocket" for each terminal, permitting
conductors between the solder lands.
14
Mixed Hole Mount and SMD Printed Circuit Boards
- Mixed PCBs are quite common due to
- Technical issues
- Component availability and cost
- Available capacity and performance of equipment
in PCB manufacturing line(s).
Fig. 6.5 Common types of SMD- and mixed
SMD-/hole mount PCBs.
15
SMD Printed Circuit Boards
- Important aspects of design
- Component heat tolerances for reflow-/wave solder
processes - Component orientation for wave solder
- Shadowing
- Solder thieves for wave soldering
- Minimum distance between components
- Isolated via holes/solder lands
Fig. 6.6 Preferred and not preferred directions
of SMD components during wave soldering.
16
Important Aspects of Design, continued
- Fig. 6.7 Minimum separation between SMD
components during wave soldering.
17
Important Aspects of Design, continued
- Fig. 6.8 Solder lands for SMD components should
be separated from heavy copper areas by narrow
constrictions. Conductors should preferably leave
the solder lands of one component symmetrically.
18
Important Aspects of Design, continued
- Fig. 6.9 Via holes should be separated from
solder lands.
19
Important Aspects of Design, continued
- Fig. 6.10 Dummy land for better control of the
amount of adhesive in wave soldering process.
20
Important Aspects of Design, continued
- Fig. 6.11 "Solder thieves" are areas in the Cu
layer to reduce bridging in wave soldering.
21
Important Aspects of Design, continued
- Fig. 6.12 Parameters defining solder land
dimensions for SMD resistors and capacitors,
please refer to Table 6.2.
22
Solder Land Dimensions
- Table 6.2 Solder land dimensions for SMD
resistors and capacitors (mm), please refer to
Figure 6.12.
23
Solder Land Dimensions, continued
- Fig. 6.13 Additional dimensions of SMD component
and solder lands. Width a a Wmax K
Length b Reflow b Hmax 2Tmax K
Wave b Hmax 2Tmax 2K Length B B Lmax
2Hmax 2Tmax K, K 0.25 mm.
24
Solder Land Dimensions, continued
- Fig. 6.14 Solder land dimensions for SMD
transistors and diodes.
25
Solder Land Dimensions, continued
- Table 6.3 Solder land dimensions for SO or VSO
components (mm), please refer to Figure 6.15.
Fig. 6.15 Solder land dimensions for SO and VSO
packages, please refer to Table 6.3.
26
Solder Land Dimensions, continued
- Fig. 6.16 Solder land dimensions for PLCC, LLCC
and flatpacks, please refer to Tables 6.4 - 6.7. - a Bmax 0.1 mm B width of leas
- b Fmax 0.4 mm F length of lead footprint
- A,B Emax 0.8 mm E separation between lead
ends
27
Solder Land Dimensions, continued
- Table 6.4 Solder land dimensions for PLCC (mm),
please refer to Figure 6.16. Pitch, P 1.27
(0.050") a 0.63 b 2.0
Table 6.5 Solder land dimensions for LLCC (mm),
please refer to Figure 6.16. Pitch, P 1.27
(0.050") a 0.63 b 2.5
28
Solder Land Dimensions, continued
- Table 6.6 Solder land dimensions for flatpacks
(mm), please refer to Figure 6.16. b 2.5
29
Solder Land Dimensions, continued
- Fig. 6.17 Solder land dimensions for TAB.
30
Design for Testability
- Fig. 6.18 a) Correct position of test point,
separated from solder land. b) Test points on
solder lands are not recommended. c) Testing
on components or component leads should be
avoided.
31
Design for Testability, continued
- Fig. 6.19 Examples of test point placement on a
grid with 0.1 spacing, for testing of SMD
components with 0.05 pitch.
32
Testability
- Defect level
- DL (ppm) 1 - Y(1-T) x 106
- DL defect level
- Y yield
- T fault coverage
- Test Methods
- Functional test
- In-circuit test
- Scan path
- Boundary scan
- Built-in self test
33
Test Principles
- Guidelines for Test Strategy
- Single sided (normally) - double sided test
fixtures are expensive and less robust - Separate test points - avoid using component
leads or solder lands - 0.1" grid (normally) - 0.05 test probes are
fragile - Solder on test points for reliable contact
- Watch out and consider possible problems with
high components
34
Material Considerations for Thermal Compatibility
- Fig. 6.20 Mechanical strain is caused by
difference in coefficient of thermal expansion
(TCE), and changes in temperature. The magnitude
of the corresponding stress depends on
dimensions, temperature difference/change, and
the elastic moduli of the materials.
35
Thermal Design
- Fig. 6.21 a) Heat flow from hole mounted and
surface mounted components on a PCB. b)
Relative amount of heat removed by conduction,
convection and radiation, from DIP hole mounted
components and SMD LLCC components - typical
values.
36
Thermal Design
- Fouriers law
- Q DT/RT
- RT (1/K) (L/A)
- Q Heat flow W
- DT Temperature difference C
- RT Thermal resistance C/W
- K Thermal conductivity W/mC
- L,A Length / cross-section
- Equivalent to Ohms law
- I DU/Rel
- Rel 1/s L/A
- Convection Q h A DT
- h convection coefficient W/m oC
Fig. 6.22 a) Heat flow due to conduction -
Fouriers equation. b) Heat flow due to
convection.
37
Thermal Design, continued
- Thermal Resistance
- Rjc Thermal resistance junction - case
- Rjl Thermal resistance junction - lead
- Rja Thermal resistance junction - ambient
- Tj Ta P Rja
- Ta Ambient temperature
- Tj Junction temperature
Fig. 6.23 Thermal model of an IC and package.
38
Thermal Design, continued
- Example IBMs Thermal Module for Mainframe
Logics
39
Thermal Design, continued
- Table 6.8 Typical thermal resistances for
various package types oC/W
40
Thermal Design, continued
- Table 6.9 Typical values for the effective
thermal conductivity of different types of PCBs.
41
Thermal Design, continued
- Effective Thermal Conductivity in PCBs
- Keff S (kiti) / ttot
- ki thermal conductivity layer i
- ti thickness layer i
- ttot total thickness
42
Thermal Design, continued
- Design of Right Thermal Coefficient of Expansion
(TCE) - a S ( ai Ei ti ) / S ( Ei ti )
- ti thickness of layer i
- ai TCE material in layer i
- Ei Elastic modulus of layer i
Table 6.10 Material parameters for calculating
TCE and effective thermal conductivity of metal
core boards.
gp-Untis 2003/0 VÅR 2004 - Termin 3 og 4
HØGSKOLEN I VESTFOLD 09.01.04 09.25 2 MT2 2.år
Bachelor Mikroteknologi
DET TAS FORBEHOLD OM ENDRINGER
43
Thermal Design, continued
- Fig. 6.24 Cross section and thicknesses for a
practical PWB with two Cu/Invar/Cu cores. The
thicknesses were designed to get an over-all TCE
of 7.5 ppm/C m The achieved value was
measured to be 9.3 ppm/C m Calculated
effective thermal conductivity in the x - y
directions was 21 W/ C m
44
Thermal Design, continued
- Fig. 6.25 a) Pin-grid package with cooling
fins. b) Measured thermal resistance in the
component with forced air cooling.
45
Thermal Design, continued
- Fig. 6.26 LLCC package with thermal solder lands
and thermal vias connected to a metal core in the
PCB.
46
Thermal Design, continued
- Improved Cooling
- Thermal vias
- Cooling fins
- Fan
- Thermally conducting gas helium, fluorocarbon
- Liquid water, fluorocarbon, oil
- Boiling liquid
- Heat pipe
- Impingement cooling
- Microbellows
- Microgrooves
47
Thermal Design, continued
- Fig. 6.27 a) Forced air convection in a
channel between two PCBs (Texas Instruments) - b) water-cooled heat exchanger for edge cooling
of PCBs and temperature distribution
(qualitative).
48
Thermal Design, continued
- Fig. 6.28 Heat convection coefficient in
different cooling media for natural convection,
forced convection and boiling
49
Thermal Design, continued
- Fig. 6.29 "Microbellows cooling" A jet of water
or other cooling liquid impinges on the backside
of the chip. The bellow structure is necessary to
accommodate thermal expansion
50
Thermal Design, continued
- Fig. 6.30 Cooling by forcing liquid through
microscopic, etched channels in the semiconductor
chip 6.32. The channels are approximately 400
µm deep and 100 µm wide.
51
Thermal Simulation
- Fig. 6.31 Bar diagram for calculated
temperatures on each component chip by the
thermal simulation program TMOD.
52
High Frequency Design
- When needed?
- tr lt 2.5 tf
- tr 10 - 90 rise time
- tf l/v
- tr is 10-90 rise time
- tf is time-of-flight-delay over the length l of
critical conductor paths of the circuit - v is propagation speed v c/?er
- c speed of light
- er effective relative dielectric constant
53
High Frequency Design
- Fig. 6.32 Distributed parameters in a model of a
loss free transmission line. C and L are
capacitance and inductance per m length.
54
High Frequency Design
- Fig. 6.33 The analogous lossy line contains a
conductor series resistance R and dielectric loss
conductance G, both per m length.
55
High Frequency Design
- Table 6.11 Signal propagation speed in different
media. v c0/(Öer) 30 (cm/ns)/Öer
56
High Frequency Design, cont
- Characteristic Impedance
- V ZoI
- Zo characteristic impedance
- Zo ((R jwL)/(G jwC))1/2
- w angular frequency
- R resistance per unit length
- L inductance per unit length
- C capacitance per unit length
- G loss conductance per unit length
- In loss free medium
- Zo ?(L/C)
- Reflection coefficient
- R (Z1 - Z2)/(Z1 Z2)
- Z1 and Z2 characteristic impedances of media 1
and 2
57
High Frequency Design, continued
- Fig. 6.34 Distorted signal as a function of
time when the transmitter has 78 ohms impedance
and the receiver has different impedances as
indicated. If the receiver also has 78 ohms
impedance the signal at the receiver is a time
delayed replica of the transmitted signal.
58
High Frequency Design, continued
- Fig. 6.35 Geometries for obtaining a controlled
characteristic impedance.
59
High Frequency Design, continued
- Fig. 6.36 Expressions for characteristic
impedance, Zo, signal propagation speed, TPD,
capacitance per unit length, Co, and crosstalk,
XTalk, in different geometries a) coaxial, b)
microstrip c) stripline. The expression for
coaxial geometry is exact, the others are
approximate and valid only in certain parameter
ranges.
60
High Frequency Design, continued
- Fig. 6.37 Dependence of the characteristic
impedance on geometric dimensions, for a)
Striplineb) Microstrip. w is the signal
conductor width, S is the distance between ground
planes for stripline, and H the distance between
signal conductor and ground plane for microstrip
(please refer to Figure 6.35). Curves are shown
for different signal conductor thicknesses, t.
a
b
61
High Frequency Design, continued
- Fig. 6.38 Cross talk A signal from A to C is
transmitted to the B - D line and gives noise in
B (backward or near end cross talk) and in D
(forward or far end cross talk).
62
High Frequency Design, continued
- Fig. 6.39 Backward cross talk as a function of
conductor separation in stripline geometry in
different dielectrics. The effect increases with
increasing er and decreases with increasing
conductor separation.
63
Attenuation
- Vb Va exp(-al)
- a Attenuation coefficient
- a (ar, as ) ad
- ar dominates at low frequencies
- as at high frequencies (GHz)
- ar R / (2Zo)
- as (p mr mo f r)1/2 / (w Zo) for skin depth
ds (r / p f mr mo)1/2 ltlt t - ad p (eoe)1/2 f tan d/ c
- R ohmic resistance per unit length
- r electrical DC resistivity in the conductor
- t conductor thickness
- tan d dielectric loss tangent
- w conductor width
- f frequency
- m mr mo magnetic permeability
64
Attenuation, continued
- Fig. 6.40 High frequency skin depth for copper,
and conductor resistance due to skin effect,
relative to the DC resistance. The resistance has
increased by approx. a factor 2 when the skin
depth d is one half of the conductor thickness t.
65
Attenuation, continued
- Fig. 6.41 Conductor- and dielectric losses as
functions of frequency for multilayer thin film
modules.
66
Design of Flexible Printed Circuits
- Fig. 6.42 Bending of double layer flexible print
with different conductor layout. The Figure shows
the number of cycles before failure with 5, 10
and 20 mm bending radius and 180 angel of
bending. (Data Schoeller Elektronik). If the
copper layer in the bending zone is strained 16
or more it is likely to fail during the first
cycle.
67
Design of Flexible Printed Circuits, continued
a)
c)
b)
- Fig. 6.43 a) Solder lands on flexible prints
should be rounded in order to reduce the
possibility for failures, b) The contour of the
board should be rounded in order to reduce
possibilities for tearing (dimensions in inches).
The "rabbit ears" on the ends of the metal foil
is for obtaining better adhesion to the
polyimide. c) Plastic rivets should be used to
avoid sharp bends in the interface between the
flexible and the rigid parts of the PCB.
68
Design of Membrane Switch Panels
- Fig. 6.44 Detail of a membrane switch panel. The
tail with interconnections to the panel is
protected with a laminated foil. Light emitting
diodes may be attached with conductive adhesive.
Screen printed polymer thick film series
resistors may be used.
69
Design of Membrane Switch Panels
- Fig. 6.45 Contact areas of membrane switch panel
with back lighting and window. Examples of
lighted text on a dark background and the
opposite combination. If a metal dome is used the
information has to be next to the key and not
underneath it.
70
System Level Modelling
- Fig. 6.46 The SUSPENS model for the different
levels in an electronic system. The symbols are
parameters characterising the system and
different technologies of the system. They are
quantified and used to compare or optimise
different possible versions of the system in
computer calculations.
71
End of Chapter 6 Printed Circuit Board Design
- Important issues
- When designing PCBs
- Working with the right people including marketing
and production people - Working with the best tools
- Use good Design Guidelines and do not violate
Design Parameters - Robust design to allow for process variations
- Use solder land dimension templates
- Design for test
- Specific design methods for applications with
specific requirements - High speed, high power etc.
- Questions and discussions?
Recommended
CrystalGraphics Presentations


