
Inference on Two Samples - PowerPoint PPT Presentation
1 / 26
Title:
Inference on Two Samples
Description:
Independent versus ... A sampling method is independent when the individuals selected for ... the following are independent or dependent samples. ... – PowerPoint PPT presentation
Number of Views:35
Avg rating:3.0/5.0
Title: Inference on Two Samples
1
Chapter 10 Inference on Two Samples Section
10.1 Inference about Two Means Dependent Samples
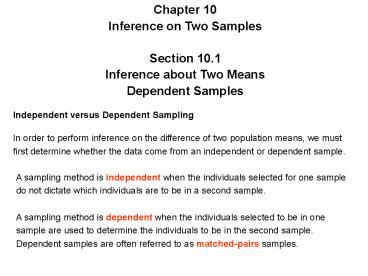
Independent versus Dependent Sampling In order
to perform inference on the difference of two
population means, we must first determine whether
the data come from an independent or dependent
sample.
A sampling method is independent when the
individuals selected for one sample do not
dictate which individuals are to be in a second
sample.
A sampling method is dependent when the
individuals selected to be in one sample are used
to determine the individuals to be in the second
sample. Dependent samples are often referred to
as matched-pairs samples.
2
- Example
- Determine whether the following are independent
or dependent samples. - A sociologist wishes to compare the annual
salaries of married couples. She obtains a
random sample of 50 married couples in which both
spouses work and determines each spouses annual
salary. - A study was conducted by researchers designed
to determine the genetic and nongenetic factors
to structural brain abnormalities on
schizophrenia. The researchers examined the
brains of 29 twin patients diagnosed with
schizophrenia and compared them with 29 healthy
twins. The whole brain volumes of the two
groups were compared.
Dependent
Independent
3
Hypothesis Tests When analyzing matched-pairs
data, we compute the difference in each matched
pair and then perform inference on the
differenced data in the same manner we learned
early. (Sec 9.3) Paired Difference d x1 x2
If we are going to make inferences on this new
data, we need statistics dealing with this type
of data.
Sample Mean of the Differences
Sample Standard Deviation of the Differences sd
4
- When the original populations are normal.
- When we obtain a sample greater than or equal to
30.
5
We can use the classical or the p-value approach
when testing a hypothesis about a mean difference.
The new parameter of interest will be ?d. So the
null and alternative hypotheses will take one of
the following forms H0 ?d 0 vs
H1 ?d ? 0 H0 ?d 0 vs H1 ?d
? 0 H0 ?d 0 vs H1 ?d ? 0
The test statistic we will use will follow a
t-distribution with n 1 degrees of freedom
6
Example Assume the following data comes from a
normal population and test the claim that the
difference is less than zero at the 0.05 level of
significance.
-0.5
1 -3.3 -3.7 0.5 -2.4 -2.9
d2 0.25 1 10.89 13.69 0.25 5.76 8.41
7
Test claim that the difference is less than zero
with the classical approach
1. Hypothesis
- Hypothesis
- Critical Value
- Test Statistic
- Decision
- Conclusion
One-sided or two-sided?
3. Test Statistic
8
5. Conclusion There is evidence at the 0.05
significance level to conclude that the mean
difference is less than 0.
9
Confidence Interval for Matched-Pairs Data A (1
- ?)100 Confidence Interval for ?d is given by
Lower Limit Upper Limit
Use the previous example to construct a 99
confidence interval.
We are 99 confident that the true mean
difference is between -4.3 and 1.1
10
Section 10.2 Inference about Two
Means Independent Samples
We will now turn our attention to inferential
methods for comparing means from two independent
samples. We will discuss only the case where
the population standard deviations are unknown.
Therefore, we will need s and the t-distribution
11
Sampling Distribution of the Difference of Two
Means Independent Samples with Population
Standard Deviations Unknown. Suppose a simple
random sample of size n1 is taken from a
population with unknown mean ?1 and unknown
standard deviation ?1. In addition, a simple
random sample of size n2 is taken from a
population with unknown mean ?2 and unknown
standard deviation ?2. If the two populations
are normally distributed or the sample sizes are
sufficiently large, then approximately
follows a t-distribution with the smaller of n1
1 or n2 1 degrees of freedom.
12
The hypothesis testing procedure will again be
similar to what we have already done. However,
now the null and alternative hypotheses will take
one of the following forms H0 ?1 - ?2 0
vs H1 ?1 - ?2 ? 0 H0 ?1 - ?2 0
vs H1 ?1 - ?2 gt 0 H0 ?1 - ?2 0
vs H1 ?1 - ?2 lt 0
Note that this is equivalent H0 ?1 ?2
And under the H0, we have
13
Constructing a (1 - ?)100 Confidence Interval
About the Difference of Two Means. Suppose a
simple random sample of size n1 is taken from a
population with unknown mean ?1 and unknown
standard deviation ?1. In addition, a simple
random sample of size n2 is taken from a
population with unknown mean ?2 and unknown
standard deviation ?2. If the two populations
are normally distributed or the sample sizes are
sufficiently large, then a (1 - ?)100
confidence interval about ?1 - ?2 is given
by Lower Limit Upper Limit
14
Example Test the claim that ?1 gt ?2 at the 0.1
level of significance for the following data.
Also construct a 95 confidence interval.
- p-value approach
- Hypothesis
- Test Statistic
- p-value
- Decision
- Conclusion
1. Hypothesis
One-sided or Two-sided?
2. Test Statistic
What about df?
18 1 17
15
3. p-value P(t17 gt 3.081) ? ? (0.0025 lt
p-value lt 0.005)
4. Decision p-value lt 0.005 lt 0.10 a Reject H0
5. Conclusion There is evidence at the 0.10
significance level to conclude that the mean of
population 1 is greater than population 2.
16
95 Confidence Interval
We are 95 confident that the true difference in
population means is between 2.6 and 13.8.
17
Section 10.3 Inference about Two Population
Proportions
We will now discuss inferential methods for
comparing two population proportions.
Sampling Distribution of the Difference between
Two Proportions. Suppose A simple random
sample of size n1 is taken from a population
where x1 of the individuals have a specified
characteristic and A simple random sample of
size n2 is independently taken from a different
population where x2 of the individuals have a
specified characteristic. The sampling
distribution of is approximately normal with mean
p1 p2 and standard deviation provided
that n1p1 gt 5, n1q1 gt 5, n2p2 gt 5 and n2q2 gt
5. And
18
Now that we know the approximate sampling
distribution of , we can
introduce a procedure that can used to test
claims regarding two population proportions.
Let us first consider the test statistic. It
would seem logical that the test statistic would
be
However, when we test a hypothesis, the null
hypothesis is assumed true.
When comparing two population proportions, the
null hypothesis will always be H0 p1 p2 0.
This null hypothesis is assuming that the value
of p1 equals the value of p2. Since the null
hypothesis is assumed to be true, we are assuming
p1 p2 p, where p is the common population
proportion.
19
Substituting the value of p into the equation for
the test statistic, we obtain a new test statistic
We need a point estimate of p because it is
unknown. The best point estimate of p is called
the pooled estimate of p, denoted
Pooled Estimate of p
Under H0
Hence, the test statistic we will use in
hypothesis testing is
20
Confidence Intervals for the Difference between
Two Population Proportions Lower Limit
Upper Limit
Notice that we do not pool the sample
proportions. This is because we are not making
any assumptions regarding their equality as we
did in hypothesis testing.
21
Example On April 12, 1955, Dr. Jonas Salk
released the results of clinical trials for his
vaccine to prevent polio. In these clinical
trials, 400,000 children were randomly divided in
two groups. The subjects in Group 1 (the
experimental group) were given the vaccine, while
the subjects in Group 2 (the control group) were
given a placebo. Of the 200,000 children in the
experimental group, 33 developed polio. Of the
200,000 children in the control group, 115
developed polio. Test the claim that the
percentage of subjects in the experimental group
who contracted polio is less than the percentage
of subjects in the control group who contracted
polio at the 0.01 level of significance. Also,
construct a 90 confidence interval for the
difference between the two population proportions.
1st Check normality assumptions
22
- p-value approach
- Hypothesis
- Test Statistic
- p-value
- Decision
- Conclusion
Test the claim that the percentage of subjects in
the experimental group who contracted polio is
less than the percentage of subjects in the
control group who contracted polio at the 0.01
level of significance.
1. Hypothesis
One-sided or Two-sided?
2. Test Statistic
23
3. p-value P(Z lt -6.48) 0
4. Decision p-value lt 0.01 a ? Reject H0
5. Conclusion There is significant evidence at
the 0.01 significance level that the rate of
polio is lower in the experimental group than the
rate in the control group.
24
90 Confidence Interval
We have a 0.10 0.00016 - 0.00058
-0.00042 n1 200,000 n2 200,000
We are 90 confident that the proportion of kids
who contracted polio in the experimental group is
between 0.0003 and 0.0005 less than the
proportion in the control group.
25
Hypothesis Testing
Which Parameter?
p
1-sample
1-sample
2-sample
2-sample
s known
s unknown
Dependent
Independent
26
End of Notes!!!!
Recommended
CrystalGraphics Presentations


