
Real Time Intracranial EEG Experimental Interface - PowerPoint PPT Presentation
1 / 5
Title:
Real Time Intracranial EEG Experimental Interface
Description:
The signal can be characterized by its frequency content into special ... acquisition for the Primordial Anisotropy Polarization Pathfinder Array (PAPPA) ... – PowerPoint PPT presentation
Number of Views:25
Avg rating:3.0/5.0
Title: Real Time Intracranial EEG Experimental Interface
1
Real Time Intracranial EEG Experimental Interface
Abstract Electroencephalography (EEG) measures
potential differences within the brain generated
by the firing of neurons. The signal can be
characterized by its frequency content into
special frequency bands. It is hypothesized that
certain frequency components of EEG correspond to
heightened cognitive abilities. The 4-8 Hz
frequency band (also known as the theta band)
has been linked to greater memory performance.
To test this hypothesis, a Brain Computer
Interface (BCI) was created that used recorded
EEG activity to drive a real time memory
retrieval experiment. The current system was
constructed as a platform for real time cognitive
experimentation. An interface was created that
allowed maximum control of experimental
conditions. Two classifiers were used to
characterize incoming EEG activity. The spectral
classifier maximized the speed under which the
experiment was conducted while the Neural Network
Classifier used all available spatial EEG
information. The classifiers were used to
characterize the incoming EEG into two states
theta or not theta. Based on this binary
classification, an experimental output was
modified. In this case, the experimental output
was the presentation of a word to the patient on
a computer screen each time a theta event was
discerned. The hypothesis is that words
presented during high theta activity will be
remembered by the patient at a greater rate than
words presented randomly. Authors John Burke
EE 07 Kylash Viswanathan EE 07 Ronald
Williams EE 07 Advisors Prof. Nabil Farhat Dr.
Kareem Zaghloul Prof. Michael Kahana Special
Thanks Joshua Jacobs, Neuralynx Inc. Demo Times
Thursday, April 19, 2007
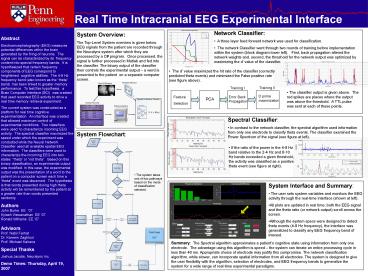
- Network Classifier
- A three layer feed forward network was used for
classification. - The network Classifier went through two rounds
of training before implementation within the
system (block diagram lower left). First, back
propagation altered the network weights and,
second, the threshold for the network output was
optimized by maximizing the d value of the
classifier.
System Overview The Top-Level System overview
is given below. EEG signals from the patient are
recorded through the Neuralynx system after which
they are processed by a C program. Once
processed, the signal is further processed in
Matlab and fed into the classifier. The binary
output of the classifier then controls the
experimental output a word is presented to the
patient on a separate computer screen.
- The d value maximized the hit rate of the
classifier (correctly predicted theta events) and
minimized the False positive rate (see figure
above).
Training II
Training I
- The classifier output is given above. The red
spikes are places where the output was above the
threshold. A TTL pulse was sent at each of these
points.
D prime maximization
Feature Selection
Error Back Propagation
PCA
- Spectral Classifier
- In contrast to the network classifier, the
spectral algorithm used information from only one
electrode to classify theta events. The
classifier examined the Power Spectrum of the
signal (see figure at left).
System Flowchart
- If the ratio of the power in the 4-8 Hz band
relative to the 2-4 Hz and 8-10 Hz bands exceeded
a given threshold, the activity was classified as
a positive theta event (see figure at right).
- The system takes one of two pathways based on
the mode of classification selected.
- System Interface and Summary
- The user sets system variables and monitors the
EEG activity through the real-time interface
(shown at left). - All plots are updated in real time both the EEG
signal and the theta ratio (or network output)
scroll across the screen. - Although the system specs were designed to detect
theta events (4-8 Hz frequency), the interface
was generalized to classify any EEG frequency
band of interest.
Summary The Spectral algorithm approximates a
patients cognitive state using information from
only one electrode. The advantage using this
algorithm is speed the system can iterate an
entire processing cycle in less than 40 ms.
Appropriate choice of electrode may justify this
compromise. The network classification algorithm,
while slower, can incorporate spatial information
from all electrodes. The system is designed to
give the user flexibility with the algorithm,
selection of electrodes, and EEG frequency bands
to generalize the system for a wide range of
real-time experimental paradigms.
2
(No Transcript)
3
Redundant Flight Computer Control System for
PAPPA Balloon Telescope
ABSTRACT Data acquisition for the Primordial
Anisotropy Polarization Pathfinder Array (PAPPA)
project balloon flight requires constant
communication between the flight telescope and an
onboard computer. However, conditions at flight
altitude cause computers to become unreliable. A
redundant computer control system, consisting of
two identical computers connected to the
telescope through a watchdog circuit, aims to
deliver continuous computer control over the
telescope. AUTHORS Marc Blanco CTE
05 Shlomo Katz EE 05 ADVISOR Dr. Mark
Devlin Professor of Physics University of
Pennsylvania DEMO TIMES Thursday, April 21th,
2005 930, 1030, 1100, and 1130 AM GROUP
4 UNIVERSITY OF PENNSYLVANIA Department
of Electrical and Systems Engineering
Baseband Analog Bursts
WATCHDOG CIRCUIT The monitor subcircuit examines
the computers output for correctness. If the
output is incorrect, the countdown timer issues a
momentary failure signal. This induces the
computer power subcircuit to reboot the
computer, and allows the switchover relays to
choose the correct computers output to be sent
to the telescope.
SYSTEM OVERVIEW Two Linux PC's are used to
control and store data from external devices.
Each computer sends and receives data via serial
and parallel port interfaces, and can generate
analog output voltages through a National
Instruments card. The computers connect to the
telescope through a watchdog circuit. Each
computer sends and receives data as if it alone
is in control of the system, but the watchdog
chooses one computer whose control data is passed
on to the telescope.
SYSTEM IN ACTION
A screen capture of various signals at the moment
when computer 1 fails. Shortly after failure, the
computer is rebooted and telescope control is
switched to computer 2 (whose control signal is
0V DC). Rebooting is triggered by grounding the
reboot pin, which is seen here as a decrease in
noise on (4). (For demonstration purposes, the
control signal here comes from a function
generator, not from computer 1. Thus, (1) is
active even after the computer fails.)
The watchdog circuit connects 16 telescope output
lines to both computers, sends 28 input lines to
the telescope from one of the computers, and
continuously monitors the parallel port output
from each computer. In the absence of a
characteristic signal on one computer's parallel
port, the watchdog reboots that computer and
switches telescope control to the working
computer. If necessary, extra watchdog circuit
cards can be mounted on top of the primary card,
and used to switch additional input and output
lines based on the control decisions made by the
primary watchdog circuit.
At this moment, computer 1 is being rebooted (one
reboot light is on, one power light is off, and
control has been switched to computer 2)
Complete setup, involving watchdog circuit and
two computers
4
Robodog Frontal Facial Recognition
AUTHORS GROUP 5 Jing Hu EE 05 Jessica
Pannequin EE 05 Chanatip Kitwiwattanachai EE 05
ADVISORS Dr. Daniel Lee Dr. Nabil Fahrat
Special Thanks to Paul Vernaza
Picture from Dog
University of Pennsylvania Department of
Electrical and Systems Engineering ABSTRACT Fac
ial Recognition has drawn a significant amount of
attention in the research area in the past few
years. There is an increasing interest in the
implementation of facial recognition systems
because of the emerging demands of more efficient
security systems. The ability to take into
account differences in lighting conditions,
facial orientation and background objects is
crucial for the implementation of a successful
system. Many different approaches of the problem
have been developed over the past two decades. So
far, each proposed method has different
comparative advantages and disadvantages. With
the chosen approach of this project, the face
region is first extracted from the original
picture using skin color analysis. The facial
features are then generated from the face
region. By doing so, the background noise can be
eliminated, thus increasing the recognition
accuracy and decrease the computation volume of
the system. The facial features are then fed
into a neural network to overcome image
distortion due to lighting condition, facial
expression and orientation of the face.
Finally, in order to enhance the role of
human-robot interaction for which recognition is
a crucial capability, the Sonys Aibo Dog is used
as the interface to the system.
Gray Scale Image First Crop
Skin Color Analysis
Rotation
Second Crop
Dog Reaction
Minimum Error
Feature Vector
Trained Neural Network
Recognition Algorithm
Feature Extraction
Graphical User Interface
Recognition Algorithm
The neural network outputs five errors, each
measuring the level of similarity with one of the
individuals trained by the network. The lower the
error, the closer the person is to one of the
trained individuals. Therefore, the smallest
error indicates who was recognized in a given
picture. In order to improve the robustness of
the system, the following algorithm is
implemented. Instead of determining recognition
based on a single picture,
Neural Network Training
For each person, 400 pictures are stored in a
database, with different facial orientations or
expressions. At each iteration, a picture is
taken at random from the database and passed once
through the neural network. The network is
trained over 150,000 iterations, which allows on
average each picture to be trained 75 times.
First Image Min Error1 lt 0.005?
Yes
Recognition
No
Second Image Min Error2 lt 0.005?
Yes
Recognition
Pass features through the Network once and adjust
the weights Wij and Wjk
No
a group of pictures is analyzed. At each stage, a
measure of the minimal error helps determine if
an immediate conclusion is possible or whether an
additional picture is required.
Yes
Min Error belongs to the same person as in 1st
Image?
Recognition
Neural Network Outline with three layers
Neural Network
Three most prominent SIFT Features of random
picture from database
No
Third Image Min Error3 lt 0.005?
Yes
After all iterations
Recognition
Recognition
Sample Set
Repeat for 150,000 iterations
No
Yes
Min Error1
No
Yes
Min Error belongs to the same person as in 1st
or 2nd Image?
Is Min Error of single Picture lt 0.05?
Recognition
Final Weights Wij and Wjk
Min Error2
Yes
No
No
Min Error3
Does Min belong to pair of pictures?
Take Minimum of 3 Errors
Convergence of Neural Network weights during
training
Start over with new group of pictures
Convergence of 1 element in the Wij matrix
Convergence of 1 element in the Wjk matrix
Recognition Results
Facial Database
95
88
85
86
84
Convergence of 1 element in the Delta Wjk matrix
Convergence of 1 element in the Delta Wij matrix
JP
JH
CH
FR
SG
86
88
95
85
84
DEMO TIMES Thursday, April 21st, 2005 930AM,
10AM, 1PM and 130PM
Note The Delta Wij and Delta Wjk matrices
correspond to the adjustment to the
Weights performed at each iteration. After
successful training, these numbers should
converge to zero, as shown on the above graph.
87.6 Rate of Success
5
(No Transcript)
Recommended
CrystalGraphics Presentations


