
The University of Toledo - PowerPoint PPT Presentation
1 / 52
Title: The University of Toledo
1
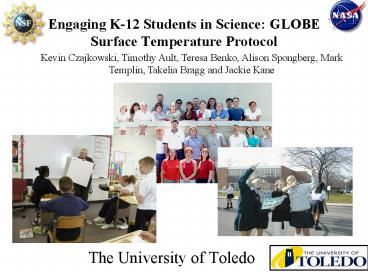
Engaging K-12 Students in Science GLOBE Surface
Temperature Protocol
Kevin Czajkowski, Timothy Ault, Teresa Benko,
Alison Spongberg, Mark Templin, Takelia Bragg and
Jackie Kane
- The University of Toledo
2
- Outline
- GLOBE/SATELLITES Background
- Validation of Snow Remote Sensing
- Surface Temperature Protocol
- Iowa Project, Are untilled fields or
conservation tilled fields warmer? - Examples of Student Inquiry-based Projects
3
Our Team
Dr. Kevin Czajkowski Remote Sensing/Atm. Science
Terri Benko Outreach Coordinator
Janet Struble Education Coordinator
Dr. Alison Spongberg Soil Scientist
Dr. Mark Templin Science Education
Timothy Ault Research Tech
Jackie Kane In-service Teacher
Takelia Bragg Student Tech
4
- Over 12,000 Schools Worldwide
- Over 20,000 Teachers Trained
- 103 Countries
- Earth Science Education Program
- Sponsored by NASA and NSF
- Science and Education Program
- Students, teachers and researchers work together
to solve current environmental problems - Inquiry-based Learning
GLOBE Cloud Data 3/27/2003
5
(No Transcript)
6
(No Transcript)
7
(No Transcript)
8
(No Transcript)
9
(No Transcript)
10
(No Transcript)
11
(No Transcript)
12
Why Study Snow? To Monitor Climate Changes
- Changes in snow cover will change the amount of
sunlight absorbed and the amount reflected back
to space affecting the temperature
13
Can you see the snow through the clouds?
Feb. 4, 2002
MODIS Visible Band
14
(No Transcript)
15
MODIS Data vs. Student Data
Student Observations
MODIS Data
Clouds 2,161 Student Snow Observations Not Used
16
School Observation Sites Classified as Water by
the MODIS Snow Product
17
MODIS Designated Clouds vs. Student Observations
18
MODIS Designated Clear vs. Student Observations
19
What We Did
A Students Investigation
Visual Approach - Satellite Image Analysis
By Ms. Julia Gehring and Ms. Jackie Kane,
Advisor St. Ursula Academy
(Toledo, OH)
- Took 35 MODIS satellite images from the
University of Toledos server http//www.remotesen
sing.utoledo.edu/education/student_obs/index.html
Looked for irregularities in classification. - Tested using GLOBE student data and National
Weather Service data.
20
February 1, 2002
- Narrow strip of snow running SW to NE
- Archived weather data showed temperatures of
previous week above freezing - Student data reported no snow
- Rating
MODIS Snow Product
21
Why do We Measure Surface Temperature?
- To help us understand the influences on the rate
of heat exchange between the Earths surface and
the atmosphere. This impacts the weather and
climate and can help us understand Global Warming
and the urban heat island effect.
22
Surface Temperature Data Collection
- Students report Ts measurements, wet/dry surface
conditions, universal time, and snow depth (up to
9 samples), and cloud conditions (cover, type,
contrails). - Each study site includes location,coverage type
data (grass, asphalt, bare soil, etc.), and study
site size (e.g. 302m2 to ideally 902m2 area). - We asked students to observe a grassy area
and a parking lot. - Sites are Geo-coded by latitude and longitude
coordinates - We use Raytek ST20 Infrared Thermometer
(IRTs), i.e. non-contact thermometer, to
measure Ts.
23
Surface Temperature is at the Heart of the
Energy Budget
Incoming sunlight heats the surface
Evapotranspiration cools the surface
Sensible heat rises from the ground
Emitted energy cools the surface to space
Surface Temperature
Heat goes into the ground
24
Urban Heat Island EffectValidate Satellite
Algorithms
25
Surface Temperature Measurement Techniques by
Scientists
Hand-held IRT
Tower Mounted IRT
26
Central Catholic Students Taking Surface
Temperature Observations
Mike Hedley submitted an article to the NSTA
Science Teacher, published May 2004
27
Thermal Shock
- During our summer 2003 workshop, teachers noticed
that the IRTs did not match 5 C difference
noticed. - The IRT reads incorrectly if going from inside to
outside if the temperature was much different.
28
In a Walk-in Refrigerator
29
Are 9 Observations the Right Number for Students
to Take?
- Surface temperature varies significantly across
the landscape even within inches. - Need average temperature of the observation site.
- The observations cannot take too long or be too
cumbersome because teachers will not be willing
to have their students participate.
30
Total average of all 36 observations 26.4 C
31
Who has participated thus far?
Number of Observations
32
Partnerships with other GLOBE partners is
important for us to meet our goals.
Number of Observations
33
Surface Temperature Observations Taken Through
December 2005
Focus on Field Campaigns
34
Looking at School DataMonroe High School,
Monroe, Michigan
35
Diurnal Surface Temperature Observations Monroe
High School, Monroe, Michigan
November 3, 2004
36
Quality Assurance Data Entry Problems
- 16 of the observations had the incorrect UTC
(Universal Time Coordinated). - One teacher didnt read the protocol and used a
current temperature thermometer laid on the
ground. - Surface Temperature was entered in F instead of
C. - Snow depth was entered in inches or cm instead of
mm. - Drifting of snow not accounted for.
37
Surface Temperature Investigation of Untilled and
Conservation-Tilled Farm Fields
- Kevin P. Czajkowski, Timothy Ault, Terri Benko,
Takelia Bragg - The University of Toledo
38
Which is warmer?
Untilled (No-Till) Field
Conservation-Tilled Field
The ground is broken up, but some plant debris
remains.
The plant debris from last years harvest
remains in the field.
or
39
How Did We Determine Which is Hotter?
- Determined Untilled Versus Conservation Tilled
Fields Using Landsat 7 Satellite Image. - Used Student GLOBE Surface Temperature
Observations to Correct the Satellite Estimated
Ground Temperature for Atmospheric Effects. - Calculated Average Surface Temperature from the
Satellite for the Untilled and Conservation
Tilled Fields.
40
Validation (Making sure we have the right field)
41
Classification Results
Black Not a field (urban, water, road, etc.)
Gray Prairie or forest
Green No-Till Field
Brown Conservation-Tilled Field
42
Thermal Infrared Satellite Image April 4, 2005
43
Surface Temperature Spring 2005 Field Campaign
- GLOBE Schools in Iowa Measured Surface
Temperature Using Infrared Thermometers - Orchard Hill Elementary School
- Central Middle School
- Immaculate Conception
- Hoover Middle School
- Kittrell Elementary School
- St. Edwards School
- Orange Elementary School
Thank You
44
GLOBE Iowa Student Observations
45
Hoover Middle School Sites
46
Surface Temperature with the Landsat7 Thermal
Image
L723.3C GLOBE29.2C
L722.7C GLOBE30.3C
L723.8C GLOBE30.8C
47
Before
Results of Atmospheric Correction
After
48
Which is warmer?
Untilled (No-Till) Field
Conservation-Tilled Field
or
32.3º C
29.2º C
49
Inquiry-based Student Project PresentationCompar
ison of Surface Temperature Between Two Schools
50
(No Transcript)
51
My Sons Science Fair ProjectThe Temperature of
Clothes
52
Thank You!
Recommended
CrystalGraphics Presentations


