
CUAHSI Observations Data Model Briefing - PowerPoint PPT Presentation
1 / 33
Title:
CUAHSI Observations Data Model Briefing
Description:
http://www.cuahsi.org/his/documentation.html ... SiteName, e.g. Logan River Near Logan, UT. Latitude, Longitude Geographic coordinates of site ... – PowerPoint PPT presentation
Number of Views:25
Avg rating:3.0/5.0
Title: CUAHSI Observations Data Model Briefing
1
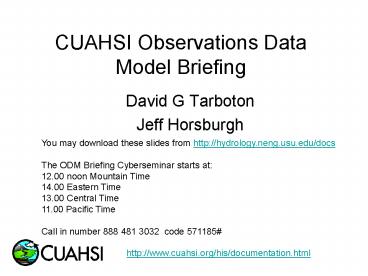
CUAHSI Observations Data Model Briefing
- David G Tarboton
- Jeff Horsburgh
You may download these slides from
http//hydrology.neng.usu.edu/docs The ODM
Briefing Cyberseminar starts at 12.00 noon
Mountain Time 14.00 Eastern Time 13.00 Central
Time 11.00 Pacific Time Call in number 888 481
3032 code 571185
http//www.cuahsi.org/his/documentation.html
2
ODM Briefing
- ODM within HIS
- ODM Design
- ODM Features and Examples
- ODM Tools
3
Downloads
Uploads
HTML -XML
Data access through web services
WaterOneFlow Web Services
WSDL - SOAP
Data storage through web services
Observatory data servers
CUAHSI HIS data servers
ODM
ODM
4
Hydrologic Data Access System
5
ODM Data Distribution Via XML Web Services
- Machine to machine communication of data over the
internet - Users can program against database as if it were
on their local machine - Accessible from within a users preferred analysis
environment (e.g. Excel, Matlab, GIS)
6
ODM Briefing
- ODM within HIS
- ODM Design
- ODM Features and Examples
- ODM Tools
7
CUAHSI Observations Data Model
- A relational database at the single observation
level (atomic model) - Stores observation data made at points
- Metadata for unambiguous interpretation
- Traceable heritage from raw measurements to
usable information - Standard format for data sharing
- Cross dimension retrieval and analysis
8
Scope
- Focus on Hydrologic Observations made at a point
- Exclude Remote sensing or grid data. These are
part of a digital watershed but not suitable for
an atomic database model and individual value
queries - Primarily store raw observations and simple
derived information to get data into its most
usable form. - Limit inclusion of extensively synthesized
information and model outputs at this stage.
9
What are the basic attributes to be associated
with each single data value and how can these
best be organized?
10
(No Transcript)
11
ODM Briefing
- ODM within HIS
- ODM Design
- ODM Features and Examples
- ODM Tools
12
Site Attributes
SiteCode, e.g. NWIS10109000 SiteName, e.g. Logan
River Near Logan, UT Latitude, Longitude
Geographic coordinates of site LatLongDatum
Spatial reference system of latitude and
longitude Elevation_m Elevation of the
site VerticalDatum Datum of the site
elevation Local X, Local Y Local coordinates of
site LocalProjection Spatial reference system of
local coordinates PosAccuracy_m Accuracy of local
coordinates State, e.g. Utah County, e.g. Cache
13
Independent of, but can be coupled to Geographic
Representation
Arc Hydro
ODM
1
Sites
1
SiteID
SiteCode
SiteName
OR
Latitude
Longitude
CouplingTable
1
SiteID
HydroID
1
14
Variable attributes
Cubic meters per second
Flow
m3/s
VariableName, e.g. discharge VariableCode, e.g.
NWIS0060 SampleMedium, e.g. water ValueType,
e.g. field observation, laboratory
sample IsRegular, e.g. Yes for regular or No for
intermittent TimeSupport (averaging interval for
observation) DataType, e.g. Continuous,
Instantaneous, Categorical GeneralCategory, e.g.
Climate, Water Quality NoDataValue, e.g. -9999
15
Scale issues in the interpretation of data
The scale triplet
a) Extent
b) Spacing
c) Support
From Blöschl, G., (1996), Scale and Scaling in
Hydrology, Habilitationsschrift, Weiner
Mitteilungen Wasser Abwasser Gewasser, Wien, 346
p.
16
From Blöschl, G., (1996), Scale and Scaling in
Hydrology, Habilitationsschrift, Weiner
Mitteilungen Wasser Abwasser Gewasser, Wien, 346
p.
17
Discharge, Stage, Concentration and Daily Average
Example
18
Data Types
- Continuous (Frequent sampling - fine spacing)
- Sporadic (Spot sampling - coarse spacing)
- Cumulative
- Incremental
- Average
- Maximum
- Minimum
- Constant over Interval
- Categorical
19
15 min Precipitation from NCDC
Incomplete or Inexact daily total occurring.
Value is not a true 24-hour amount. One or more
periods are missing and/or an accumulated amount
has begun but not ended during the daily period.
20
Irregularly sampled groundwater level
21
Offset
OffsetValue Distance from a datum or control
point at which an observation was made OffsetType
defines the type of offset, e.g. distance below
water level, distance above ground surface, or
distance from bank of river
22
Water Chemistry from a profile in a lake
23
Groups and Derived From Associations
24
Stage and Streamflow Example
25
Daily Average Discharge ExampleDaily Average
Discharge Derived from 15 Minute Discharge Data
26
Methods and Samples
Method specifies the method whereby an
observation is measured, e.g. Streamflow using a
V notch weir, TDS using a Hydrolab, sample
collected in auto-sampler SampleID is used for
observations based on the laboratory analysis of
a physical sample and identifies the sample from
which the observation was derived. This keys to
a unique LabSampleID (e.g. bottle number) and
name and description of the analytical method
used by a processing lab.
27
Water Chemistry from Laboratory Sample
28
ValueAccuracy A numeric value that quantifies
measurement accuracy defined as the nearness of a
measurement to the standard or true value. This
may be quantified as an average or root mean
square error relative to the true value. Since
the true value is not known this may should be
estimated based on knowledge of the method and
measurement instrument. Accuracy is distinct
from precision which quantifies reproducibility,
but does not refer to the standard or true value.
ValueAccuracy
Low Accuracy, but precise
Accurate
Low Accuracy
29
Data Quality
Qualifier Code and Description provides
qualifying information about the observations,
e.g. Estimated, Provisional, Derived, Holding
time for analysis exceeded QualityControlLevel
records the level of quality control that the
data has been subjected to.- Level 0. Raw Data
- Level 1. Quality Controlled Data - Level 2.
Derived Products - Level 3. Interpreted Products
- Level 4. Knowledge Products
30
Series of Observations
A Data Series is a set of all the observations
of a particular variable at a site. The
SeriesCatalog is programmatically generated to
provide users with the ability to do data
discovery (i.e. what data is available and where)
without formulating complex queries or hitting
the DataValues table which can get very large.
31
ODM Briefing
- ODM within HIS
- ODM Design
- ODM Features and Examples
- ODM Tools
32
Managing Data Within ODM - ODM Tools
- Load import existing data directly to ODM
- Query and export export data series and
metadata - Visualize plot and summarize data series
- Edit delete, modify, adjust, interpolate,
average, etc.
33
Discussion points
- Does ODM accommodate your data
- If not what needs to be done
- Controlled vocabularies
- Data loader
- Work group servers
- ODM tools
- Wish list for features and capabilities
Recommended
CrystalGraphics Presentations


