
Oslo, - PowerPoint PPT Presentation
Title:
Oslo,
Description:
Oslo, – PowerPoint PPT presentation
Number of Views:36
Avg rating:3.0/5.0
Title: Oslo,
1
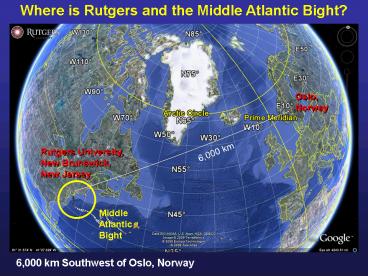
Where is Rutgers and the Middle Atlantic Bight?
Oslo, Norway
Rutgers University, New Brunswick, New Jersey
6,000 km
Middle Atlantic Bight
6,000 km Southwest of Oslo, Norway
2
Cape Cod
New Jersey
Building a Regional Ocean Observatory for the
Middle Atlantic Bight Our View from the COOLroom
Scott Glenn, Oscar Schofield, Robert Chant,
Josh Kohut, John Manderson, Janice McDonnell,
Cisco Werner, John Wilkin Plus Research Staff
Students
Cape Hatteras
3
The Mid-Atlantic Bight Ecosystem
- The Mid-Atlantic Bight is getting
- Fresher Warmer
- Experiences Some of the Largest
- Temperature Differences in the World
- Summer to Winter
- Top to Bottom
- Some of the Most Migratory
- Fish Species have Evolved
4
The Urbanized MAB Ecosystem - Developed Countries
Middle Atlantic Bight is the most Urbanized Coast
in the U.S.
Global Vessel Traffic
5
Factors Affecting Sediment Transport on the New
Jersey Shelf
Hudson River Plume
Hurricane Tracks Through New Jersey
6
Rutgers University - Coastal Ocean Observation
Lab Operations, Data Fusion Training Center
3-D Nowcasts Forecasts
L-Band X-Band Satellite Receivers
CODAR Network
Glider Fleet
7
International Constellation of Satellites Since
1992
L-Band (installed 1992)
X-Band (installed 2003)
Regional
IRS-P4 OCM Chlorophyll India
Local
MODIS United States
Global
FY1-D ch7ch9 China
8
B)
C)
- CODAR
- HF Radar
- Network
- 1998-
- 2009
E)
D)
F)
G)
H)
I)
J)
9
Autonomous Underwater Gliders
Since 1999
10
WRF Weather Forecasting Daily Cycles
11
Coupled Regional Ocean Models (ROMS) for Research
and Operations (Physics, Bio-optics, Ecology,
Sediment Transport)
12
- Industry Partners
- SeaSpace
- CODAR Ocean Sensors
- Teledyne Webb Research
- Teledyne RD Instruments
- Satlantic
- Wetsat
Observing Storm-Induced Sediment Resuspension
Processes in the Middle Atlantic Bight with
Slocum Gliders Scott Glenn, Oscar Schofield,
Robert Chant, John Wilkin, Josh Kohut, Janice
McDonnell
Coastal Observation and Prediction Sponsors
13
Rutgers Slocum Glider Fleet Missions 160
Oct 2003 Oct 2008 Glider Days 2434
Calendar Days 1250 Distance 53,000 km
Casts 331,809
Optical Sensors
Storm Track
Hurricane Tracks Through New Jersey
14
Flight to Halifax Long-Duration Test Flight
Winter Storm
Lithium Batteries DigiFin
Tuckerton Endurance Line to Halifax Endurance
Line
gt25 Foot Significant Wave Height in Storm
Winter Storm Crosses Glider Path
15
- Storm-Induced Sediment Resuspension
- Science Questions
- What differences are observed in stratified
versus unstratified seasons? - What processes influence the resuspension of
sediment? - What are the implications for the redistribution
of sediment in the MAB? - Focus Area
- Mid-shelf region of MAB
- Relatively unexplored
- Broad band of medium grain sands
16
At Sea with Sandy Williams - 1982 - R/V
Wacoma Coastal Ocean Dynamics Experiment (CODE)
Grant, W.D., A.J. Williams and S.M. Glenn, 1984.
Bottom stress estimates and their prediction on
the northern California shelf during CODE-1 The
importance of wave-current interaction, Journal
of Physical Oceanography, 14, 506-527.
17
Sediment Transport Studies at LEO Site early
1990s
Benthic Acoustic Stress Sensor (BASS) Tripod
Before and After Summer Deployment at LEO
18
LEO Seafloor Cabled Observatory Continuous
Video from the Seabed late 1990s
Lesson The importance of having a continuous
view of the sea
19
Storm sediment transport on the MAB shelf 3-D
models suggest net southward and offshore
transport of material
Wave stress
Deposition (mm)
offshore southward
Keen and Glenn (JGR JPO)
20
Storm sediment transport on the MAB shelf 1-D
models observation allow transport to
calculated during storms, net transport is
onshore!
Bottom time series collected
Models parameterized
1-D models of water column and bottom boundary
layer
storms
Significant wave height
Styles Glenn JGR
Styles Glenn JGR
We are getting the sign of the cross shore
transport wrong! Not once but all storms!
Bottom topography
offshore north
onshore south
Styles Glenn JGR
Traykovski JGR
21
Storm sediment transport on the MAB bight 1-D
models observation allow transport to
calculated during storms, net transport is
onshore!
Bottom time series collected
Models parameterized
1-D models of water column and bottom boundary
layer
storms
Significant wave height
Styles Glenn JGR
Styles Glenn JGR
We are getting the sign of the cross shore
transport wrong! Not once but all storms!
Bottom topography
offshore north
onshore south
Styles Glenn JGR
Traykovski JGR
22
Tropical Storm Ernesto Labor Day Weekend, 2006
RU-WRF is Orange
6 am Friday Morning Where do we send the ships?
23
- RU-WRF Forecast of
- Tropical Storm Ernesto
- improved model physics,
- more input data (ocean atmosphere),
- higher resolution model grids
Note WRF forecasts The transition of
Ernesto From tropical to extra-tropical after
landfall!
24
Observed Track is Yellow RU-WRF is Orange
25
Tropical Storm Ernesto September 1, 2006 1900
GMT
WRF Forecast Surface Winds
CODAR Observations Surface Currents
26
Tropical Storm Ernesto September 2, 2006 0700
GMT
WRF Forecast Surface Winds
CODAR Observations Surface Currents
27
Tropical Storm Ernesto September 2, 2006 1300
GMT
WRF Forecast Surface Winds
CODAR Observations Surface Currents
28
Tropical Storm Ernesto September 2, 2006 1300
GMT
WRF Forecast Surface Winds
CODAR Observations Surface Currents
29
Tropical Storm Ernesto September 2, 2006 1900
GMT
WRF Forecast Surface Winds
CODAR Observations Surface Currents
30
Tropical Storm Ernesto September 3, 2006 0100
GMT
WRF Forecast Surface Winds
CODAR Observations Surface Currents
31
Tropical Storm Ernesto Sub-Surface Impacts
Before
June 14, 2006 - Present
32
Tropical Storm Ernesto Sub-Surface Impacts
After
33
Tropical Storm Ernesto Feedback to the State
Accumulated Rainfall
Predicted Observed
34
Tropical Storm Ernesto Track Sensitivity
INCREASING RESOLUTION
-INCREASE IN MODEL SKILL IS GREATEST WITH
IMPROVED UNDERSTANDING Ocean-Atmosphere-Land
Interactions!!!!!!!
Operational Model Physics
INCREASING RESOLUTION
Observed Track is Yellow
Bowers et al.,
Research Model Physics
35
Tropical Storm Hanna September 57, 2008
NOAA Delaware Bay Buoy 44009
36
Tropical Storm Hanna CODAR Surface Currents
Sept 6 1800
Sept 7 0000
Sept 7 1200
Sept 7 0600
37
Tropical Storm Hanna - Satellite Ocean Color
Imagery - September 6, 2008
Indias Oceansat Chlorophyll September 04, 2008
Indias Oceansat Chlorophyll September 08, 2008
38
Tropical Storm Hanna September 6, 2008 Satellite
Imagery
September 5, Pre-Hanna SST
September 7, Post-Hanna SST
NOAA-17 Sea Surface Temperature September 4, 2008
39
Tropical Storm Hanna Hurricane Hunter Glider
September 4-13, 2008 Ocean Response to Tropical
Storm Hanna - 1) Mixing Cooling of Surface
Layer, 2) Inertial Currents Internal Waves
40
Hurricane Ivan September, 2004 Mid-Shelf
Temperature
Delaware Bay Buoy Storm Peak Conditions Wind
Speed 16 m/s Wave Height 3.8 m Peak Period
8 s
Backscatter 470 nm
41
Northeaster November 2003
Temperature
Delaware Bay Buoy Storm Peak Conditions Wind
Speed 18 m/s Wave Height 3.2 m Peak Period
6 s
Backscatter 470 nm
42
October 2003 Fall Transition Storm - Northeaster
Storm Center Passes Tuckerton - Oct 29 Backside
Westerlies 5 m/s Waves at Delaware Bay - 2 m
Oct 29
Oct 29
B
Oct 29
Oct 30
Oct 30
43
October 2003 Fall Transition Storm - Northeaster
Salinity
Temperature
Backscatter 470 nm
44
October 2003 Fall Transition Storm - Northeaster
Density
Backscatter Ratio (470/676)
Backscatter (470)
45
October 2003 Fall Transition Storm - Northeaster
Local Wave Height
Local Wave Period
Wave Bottom Velocity
Glider Vertical Velocity
October 30, 2003
46
October 2003 Fall Transition Storm - Northeaster
Black Wind Purple Currents Blue Tidal
Current Red De-tided Residual
Suspended Sediment Variability Not Bottom
Sediment Not Waves Not Langmuir Cells Nonlinear
Interaction of Storm Currents, Tides
Waves Currents to the left of the wind
1 2 3 4 5
Oct 29
Oct 30
47
Conservation of Sediment Mass Closure -
Constant Stress Layer, No Stratification
Suspended Sediment Concentration Profile
Fall Velocity / Shear Velocity Ratio
In terms of the Normalized Backscatter
Plot vs.
Find Slope
48
s
Blue Density Red Circles Backscatter Used in
Fit
Before Transition
ln(z/z(1.5m))
ln(bb(z)/ bb(1.5m))
49
s
Blue Density Red Circles Backscatter Used in
Fit
Before Transition
ln(z/z(1.5m))
ln(bb(z)/ bb(1.5m))
50
s
Blue Density Red Circles Backscatter Used in
Fit
Before Transition
ln(z/z(1.5m))
ln(bb(z)/ bb(1.5m))
51
s
Blue Density Red Circles Backscatter Used in
Fit
Before Transition
ln(z/z(1.5m))
ln(bb(z)/ bb(1.5m))
52
s
Blue Density Red Circles Backscatter Used in
Fit
Before Transition
ln(z/z(1.5m))
ln(bb(z)/ bb(1.5m))
53
s
Blue Density Red Circles Backscatter Used in
Fit
Before Transition
ln(z/z(1.5m))
ln(bb(z)/ bb(1.5m))
54
s
Blue Density Red Circles Backscatter Used in
Fit
After Transition
ln(z/z(1.5m))
ln(bb(z)/ bb(1.5m))
55
s
Blue Density Red Circles Backscatter Used in
Fit
After Transition
ln(z/z(1.5m))
ln(bb(z)/ bb(1.5m))
56
s
Blue Density Red Circles Backscatter Used in
Fit
After Transition
ln(z/z(1.5m))
ln(bb(z)/ bb(1.5m))
57
s
Blue Density Red Circles Backscatter Used in
Fit
After Transition
ln(z/z(1.5m))
ln(bb(z)/ bb(1.5m))
58
s
Blue Density Red Circles Backscatter Used in
Fit
After Transition
ln(z/z(1.5m))
ln(bb(z)/ bb(1.5m))
59
s
Blue Density Red Circles Backscatter Used in
Fit
After Transition
ln(z/z(1.5m))
ln(bb(z)/ bb(1.5m))
60
s
Blue Density Red Circles Backscatter Used in
Fit
After Transition
ln(z/z(1.5m))
ln(bb(z)/ bb(1.5m))
61
s
Blue Density Red Circles Backscatter Used in
Fit
After Transition
ln(z/z(1.5m))
ln(bb(z)/ bb(1.5m))
62
s
Blue Density Red Circles Backscatter Used in
Fit
After Transition
ln(z/z(1.5m))
ln(bb(z)/ bb(1.5m))
63
s
Blue Density Red Circles Backscatter Used in
Fit
After Transition
ln(z/z(1.5m))
ln(bb(z)/ bb(1.5m))
64
October 2003 Fall Transition Storm - Northeaster
- Fall Transition
- BBL Growth
- Rapid Increase in u as stratification is
lost - Mixing throughout watercolumn
1 2 3
4 5
RMS
Before Transition
After Transition
wf/u
October 30, 2003
65
October 2003 Fall Transition Storm - Northeaster
1 2 3
4 5
Total Load
Current Speed
Net Trans- port
October 30, 2003
66
- New Sediment Transport Results From Gliders
- Even weak stratification has a significant
impact on turbulent mixing across boundary layers - Sediment Resuspension depends on storm currents,
tides and waves - Sediment Transport depends on the complex life
history of each storm
Glenn, S., C. Jones, M. Twardowski, L. Bowers, J.
Kerfoot, J. Kohut, D. Webb, O. Schofield,
Glider observations of sediment resuspension in a
Middle Atlantic Bight fall transition storm,
Limnology Oceanography, 53(5, part 2), 2008,
2180-2196.
67
- Future Directions New Sensors for Sediment
Transport - Acoustic Doppler Current Profilers -
- Downward Looking with Bottom Tracking
- with Teledyne Webb Research
- Teledyne RD Instruments
- Accelerometers for Surface Waves
- with Oregon State University
- Turbulence Sensors Chi-Pod
- with Oregon State University
68
- Regional-Scale Conclusions
- Gliders are Proven Storm Sampling Platforms
- 2) Existing Optical Sensors Produce Unique
Sediment Transport Results Regionally
Distributed Fleets Possible Now Spatial
Patterns - 3) New Sensors Will Further Enable New Storm
Science - - Turbulent Closure Mixing
torms
Recommended
CrystalGraphics Presentations


