
mcgill freezing rain - PowerPoint PPT Presentation
1 / 32
Title:
mcgill freezing rain
Description:
Upward soil heat flux (cold air over warm ground) ... 1.) Cold Front Passage (14 cases) 2.) Residual Cold Pool (23 cases) 3.) Coastal Low (25 cases) ... – PowerPoint PPT presentation
Number of Views:31
Avg rating:3.0/5.0
Title: mcgill freezing rain
1
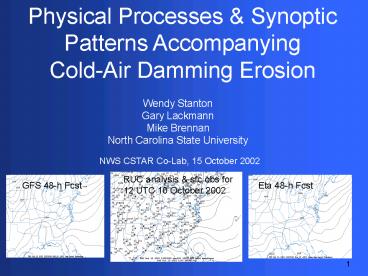
Physical Processes Synoptic Patterns
Accompanying Cold-Air Damming Erosion
Wendy Stanton Gary Lackmann Mike Brennan North
Carolina State University
NWS CSTAR Co-Lab, 15 October 2002
RUC analysis sfc obs for 12 UTC 10 October 2002
GFS 48-h Fcst
Eta 48-h Fcst
1
2
Outline
- I. Briefly review earlier research on CAD types
- A. Maximum temperature impacts
- B. Precipitating and dry CAD
- II. Recent CAD erosion research results
- A. Review of CAD erosion mechanisms
- B. Synoptic erosion scenarios
- C. Case study Model CAD erosion versus
observations
2
3
I. Earlier CSTAR CAD Research
- One of original C challenges Forecasting
issues related to Cold-Air Damming (CAD) - Earlier CAD Research (C. Bailey)
- CAD detection algorithm (captured full CAD
spectrum) - Developed CAD sub-type composites
- see http//www4.ncsu.edu/nwsfo/
- Stratification of CAD by sensible weather impacts
- Maximum temperature in damming region
- Precipitating vs. dry
3
4
A. High-Impact Vs. Low-Impact CAD
- Stratified classical CAD cases by impact on Tmax
- One composite contains cases with Tmax 15F or
more below climatology at GSO (high impact) - The other cases where Tmax was 2F or less below
climo, or above climo at GSO (low impact) - Can you tell which is which?
5
5
CAD is Not a Monolithic Phenomenon!
Sea level pressure, anomaly
HIGH-IMPACT CAD
LOW-IMPACT CAD
6
6
B. Precipitating Vs. Dry CAD
- Original CAD sub-types identified in 10-yr
climatological sample - Major distinction dry onset versus
precipitating CAD
4
7
CAD Sub-Type Summary
- Sea-level pressure does not tell the whole CAD
story! - Key upper-air features
- Upper jet dominates precipitating high-impact
cases - Ridge at 500 mb west of CAD region in dry onset
composite - 850-mb ridge axis over CAD region in dry onset
composite - E-W high elongation in precipitating, high-impact
cases - N-S elongation in dry onset weak impact cases
- For details, see Bailey et al. 2002 paper
- (submitted to WAF over the summer, in review)
7
8
II. CAD Erosion Research
- Specific NWS CSTAR challenge CAD erosion
- Model guidance Usually pre-mature erosion of
CAD cold dome. Why? - Much work needed to understand CAD erosion
- What physical processes are active?
- Do different physical processes act in different
synoptic settings? - Which processes are most problematic for NWP
models? - How can model representations be improved?
- Which situations can forecasters expect to be
most problematic?
8
9
II. A. Candidate CAD Erosion Processes
- 1.) Heating from bottom up (surface warming)
- Cold dome mixes out due to surface heating
- Solar radiation
- Upward soil heat flux (cold air over warm ground)
- Clear-air, warm season CAD often ends in this
manner
Red before Blue after
9
10
Candidate CAD Erosion Processes
- 2.) Turbulent mixing at cold dome top (inversion)
- Strength of mixing depends on strength of shear,
inversion (Ri) - Strong shear/weak inversion (small Ri) mixing
favored - Result Top-down CAD erosion
Fort Meade, MD
10
11
Candidate CAD Erosion Processes
- 3.) Divergence near surface
- Pressure falls to north, cyclone to NW of CAD
region - Stronger PGF, winds in northern CAD region
- Depth of cold dome decreases via continuity
(Lackmann Overland 1989)
Cross-sectional view
Inversion layer
UP
11
12
Candidate CAD Erosion Processes
- 4.) Inland Coastal Front Movement
- Boundary of cold dome (CF) moves inland
- May accompany pressure falls to N, surface
divergence - Usually only affects eastern areas of damming
region
12
13
Candidate CAD Erosion Processes
- 5.) Downslope Scouring Two Scenarios
- a.) Cold-Frontal Passage b.) Coastal Cyclone
- (as in Bell Bosart 1988)
L
L
13
14
B. CAD Erosion Composites
- CAD Demise Composites Surrogate for dominant
physical processes in CAD erosion - Compositing Strategy
- Used classical CAD cases, 1984-1995 (from Bailey
algorithm) - 90 total cases
- Examined patterns in MSLP and surface ?e
- Noted locations of hi/low centers fronts at
erosion times - Classified each case according to synoptic
pattern - 1.) Cold Front Passage (14 cases)
- 2.) Residual Cold Pool (23 cases)
- 3.) Coastal Low (25 cases)
- 4.) NW Low (23 cases)
14
15
(No Transcript)
16
1.) Cold-Frontal Passage
- Dominant Erosion Processes
- Downslope northwesterly flow, subsidence,
adiabatic warming - Model Performance
- Adequate, provided accurate depiction of cold
front passage - Eta often too fast with cold FROPA in North
Carolina - Features
- Cold front arrives in damming region within 6 hrs
of CAD demise
16
17
(No Transcript)
18
2.) Residual Cold Pool
- Dominant Erosion Processes
- Solar heating within cold dome
- CAD airmass doesnt always go away when Baker
ridge does - Model Performance
- Hinges on model ability to properly depict clouds
(problematic) - Largest error near surface
- Features
- Surface high ill-defined and baggy
- No synoptic systems influencing erosion
18
19
(No Transcript)
20
3.) Coastal Low
- Dominant Erosion Processes
- Downslope flow, adiabatic warming
- Divergence, cold dome air advected toward coast
- Similar to case documented by Bell and Bosart
1988 - Model Performance
- Adequate, provided accurate forecast of coastal
cyclone! - Features
- Damming region remains in cold air during erosion
20
21
(No Transcript)
22
4.) Northwestern Low
- Dominant Erosion Processes
- Solar heating surface-based mixing within cold
dome - Mixing and entrainment at inversion
- Divergence, Inland coastal front movement
- Features
- Flow in damming region becomes southerly,
pressure falls to N - CAD cold dome does not disappear just because
wind shifts!!! - Model Performance
- POOR, difficulty representing multiple physical
processes - Radiation, cloud, mixing problems
22
23
Summary of Erosion Scenario Composites
- Erosion scenario independent of CAD type
- Synoptic patterns Link to dominant erosion
process - Multiple processes may contribute to demise
- NW Low scenario most difficulty for NWP due to
nature of physical processes
23
24
Summary of Erosion Scenario Composites
- NW Low and Residual Cold Pool slowest erosion
scenarios
39 h
30 h
26 h
20 h
24
25
C. Case Study Model Experiments
- Elucidate physical process(es) of CAD erosion in
representative case study(ies) - Select two recent CAD cases in which the Eta
model exhibited large errors - Perform detailed observational analyses
- Pinpoint cause of operational model failure (with
representation of CAD erosion)
25
26
L
- 10-14 December 2001
- Onset 12/10 00Z,
- Erosion began 12/13 03Z,
- Demise 12/14 15Z
- Unusual, multi-phase event,
- NW Low erosion scenario, erosion prior to cold
frontal passage - Poorly handled erosion by Eta, esp. in SW damming
region
L
27
Case Study Eta SLP Forecast
Analysis
Eta 24-h Fcst
Eta SLP Analysis, 00Z 13 December 2001
Eta 24-h SLP forecast, valid 00Z 13 December 2001
27
28
- Bias Forecast - Analysis
- Forecast 330 K
- Analysis 318 K
- Eta ?e 12 K too high!
- Forecast stronger gradient on eastern edge of
cold wedge - Damming region can be seen in error pattern
27
29
Eta 12 hr Forecast Vs. Observed
Greensboro, NC (GSO)
Observed Red
Model Blue
12/13 at 00Z
30
Case Study Conclusions
- Observations cold dome eroded from top-down
- Model cold dome eroded from bottom-up
- Model surface heating too strong
- Too much sun gets through Eta clouds? (NCEP)
- Betts et al., 1997 and Yucel et al. 1998
- Upward heat flux in soil?
- Model sensitivity experiments underway
- Examine cloud/radiation issue (transmissivity,
path length) - Upper-air moisture profiles, cloud fraction
versus satellite
31
Thanks to
- NOAA/NWS CSTAR program (HQ, ER)
- NWS CSTAR offices (esp. Kermit Keeter, Scott
Sharp, Gail Hartfield, Neil Stuart, Larry Lee)
and many others - Jeff Waldstreicher (Profiler and RASS images,
encouragement) - NCSU Al Riordan, Chris Bailey (now at HPC), Lian
Xie - NCEP Brad Ferrier
- All of you for your comments and constructive
criticism!
31
32
RASS data
30
Recommended
CrystalGraphics Presentations


