
AURA - PowerPoint PPT Presentation
1 / 56
Title: AURA
1
AURA
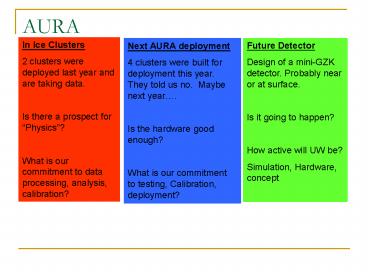
In Ice Clusters 2 clusters were deployed last
year and are taking data. Is there a prospect
for Physics? What is our commitment to data
processing, analysis, calibration?
- Future Detector
- Design of a mini-GZK detector. Probably near or
at surface. - Is it going to happen?
- How active will UW be?
- Simulation, Hardware, concept
Next AURA deployment 4 clusters were built for
deployment this year. They told us no. Maybe
next year. Is the hardware good enough? What
is our commitment to testing, Calibration,
deployment?
2
In Ice Cluster
- AURA Inroduction
- In Ice Clusters
- Deployment geometry
- Status
- Data
- External sources
- Calibration and Hardware tests.
- Prospects for analyses
3
AURA Radio Cluster
Counting house
surface junction box
surface junction box
- Digital Radio Module (DRM) Electronics
- 4 Antennas
- 1 Antenna Calibration Unit (ACU)
- Signal conditioning and amplification happen at
the front end, signal is digitized and triggers
formed in DRM - A cluster uses standard IceCube sphere, DOM main
board and surface cable lines. - Use a DOM-MB as communication platform.
- Advantage get a free design for power, comms
and time stamping.
4
Waiting to be deployed
Antenna cables
Pressure vessels
Antennas
DRM
5
RF signal
- Antennas
- Broad band dipole antennas
- Centered at 400 MHz
- Front end electronics contains
- 450 MHz Notch filter
- 200 MHz High pass filter
- 50dB amplifiers (20 dB in DRM)
- LABRADOR digitizer
- Each antenna is sampled using two 1GHz channels
to a total of 512 samples per 256 ns (2 GSPS).
6
RF Signal
- Nyquist Vrms (4KbTRDF)1/2
- V3 mVolts RMS of 3-5 bins
- Enviroment background
- Average In Ice background up to 1 GHz
- -86 dbm 2.5 E-9 mW
- After 70 db amplification
- 16 dbm ? 35mV RMS ? 30 DAC counts rms (for 2007)
- 16 dbm ? 35mV RMS ? 60 DAC counts rms (for 2009)
- Maximum signal
- Dynamic Range1200 counts
- ? 1320 mV RMS ? 15 dbm ? -55dbm 3E-6 mW
before amps (07) - ? 720 mV RMS ? 10 dbm ? -60 dbm 1E-6 mW
before amps (09)
2007 cluster mV/DAC is 1.1 2009 cluster mV/DAC
is 0.6
7
Deployment 2006-2007
Hole 57 scissors 2nd deployment, Shallow 4
Receivers, 1 Transmitters
Hole 78 rock 1st deployment, Deep 4
Receivers, 1Transmitters
Hole 47 paper 3rd Deployment, Deep 1
Transmitter
8
Triggering
Were Enough Antennas hit?
16 combinations of triggers
Band a 200-350 MHz Band b 350-500 MHz Band c
500-700 MHz Band d 600-1200 MHz
Antenna1
Antenna2
Antenna3
Antenna4
9
- The threshold on each band on each channel is
tuned independently.
Many triggers
Trigger rate
No triggers
Soft threshold
Strong threshold
DAC
10
Data, Offline analysis and logging
11
Data
- Data include
- Full Waveforms ? 4 channels x 512 bins 1
channel x 256 bins RAPCal records header - Forced trigger runs
- Real trigger runs
- Constant DAC settings
- DRM tunes it self based on a given rate parameter
per freq band - DAC scans ? for every bands
12
Offline analysis
- Offline analysis includes decoding the binary
file, time ordering, Calibration, run summaries,
FFTing, creating plots, root file and txt file
for data analysis. - http//wiki.icecube.wisc.edu/index.php/Aura_Data_P
rocess_status
13
Wave Forms
Time vs. voltage
Freq spectrum
Channel1 Channel2 Channel3 Channel4
14
DAC ScanShallow vs. Deep cluster DACs
A Shallow cluster channel
A Deep channel cluster
15
DAC scan Deep cluster
Ch 1
Ch 2
Ch 3
Ch 4
Less noise in higher freq steep slope
Band D High f
Band C
Band B
More noise in lower freq softer slope Lower DACs
Band A Low f
More noise in channels 3-4
Less noise in channels 1-2
16
The Bottom lineData taking and offline
processing
- Data is being taken, and send to the north
- Runs setting are being changed every few weeks.
- Some work is needed to tune the thresholds above
thermal/DRM noise and get stable running
17
A closer look at data
18
Run Summary
freq
time
mV
freq
mV
time
freq
mV
time
freq
time
mV
19
Solid- Real Trigger Dashed -Forced trigger
20
Where is it coming from?
t1
t2
t3
t4
21
Data Automatic monitoring
- Rick Bruess
22
The Bottom lineA closer look at data
- Data is being taken, and send to the north
- We definitely Trigger on something
- The channels below the DRMs are noisier than
channels above it. - The shallow DRM is seeing more noise than the
deep one - We have reasons to suspect that the In Ice DRMs
are noise source. - Dave Besson working on WF filtering and timing
analysis based on cross correlation.
23
Existing external sources
- RICE
- CW observed and measured by shallow cluster
- Pulse not observed,
- too weak.
- Another RICE test is scheduled.
- Other clusters ACU
- ACU too weak Development of stronger ACU
- Same ACU
- Shows signal elongation (well get back to this
point)
Xx add ray tracing xx
24
Antenna Calibration Unit
voltage
? 15 ns ?
? 40 ns ?
time
- Single ping, or
- Repeating pings (20Mhz or less)
- Timing correspond to distances between antennas.
- Transmitter probably too weak for inter-cluster
triggering
voltage
time
25
RICE CW
- Transmitter
- at 500 Mhz
- FFT of WF on
- shallow
26
RICE CW
Linearity plot
27
Measurements we can do with a Pulser
- Gain calibration
- Linearity
- Vertexing
- Time resolution measurement
- Ice properties
28
The bottom lineCalibration using external sources
- RICE CW tests were great
- RICE Pulser was not seen by AURA
- A test is scheduled for next week.
- Vertexing was not done on an external source
- We need a stronger pulses source.
- and then work on improving vertexing algorithms
and WF cleaning. - Work in KU under progress to build a stronger ACU
able to supply CW and pulses. - Another possibility Summer surface tests
29
Hardware studies and calibration Temperature
Clock Calibration
Nick Ballering
30
Clock correction
31
The bottom lineHardware studies and calibration
- The digitizer chip was developed and programmed
in Hawaii. - Some calibrations were implemented. Some were not
implemented yet. - The hardware needs more understanding, studies
and calibration - Timing
- Temperature dependence
- Gain calibration
32
The bottom line of all bottom linesIn ice
clusters
- We have 2 working clusters in ice, and data is
coming in. - There is a lot of work to do Data taking and
handling, QA, calibration, WF studies,
vertexing, timing, analyses. - Some studies were done, but this is not the real
thing yet - Coincidence with IceTop
- Constant Monitoring of the data, looking and
studying interesting events - Strong pulser for vertexing, time resolustion and
ice properties - Figuring out the time distributions of events
- To get to the real thing we first need
- Tune the run point
- Understand the WF shapes
- WF feature extraction, filtering, templating
- It is a pity not to make use of the hardware
33
AURA
In Ice Clusters 2 clusters were deployed last
year and are taking data. Is there a prospect
for Physics? What is our commitment to data
processing, analysis, calibration?
- Future Detector
- Design of a mini-GZK detector. Probably near or
at surface. - Is it going to happen?
- How active will UW be?
- Simulation, Hardware, concept
Next AURA deployment 4 clusters were built for
deployment this year. They told us no. Maybe
next year. Is the hardware good enough? What
is our commitment to testing, Calibration,
deployment?
34
- This year deployment
- Description
- Main hardware issues
- Things left to do
35
2008 clusters
- General plan built 4 clusters
- 3 sealed DRMs (2 with low freq channels)
- 1 open DRM
- Front ends, Antennas, cables
36
Changes from last year
- Use only miteq amps
- New Power Supply Unit for the DRM
- New boards layouts
- Smarter ACU
- Low frequency channels
- Decrease distances between clusters
- Special EMI care when sealing the DRM
37
What was tested
- Link to tests results wiki
- http//wiki.icecube.wisc.edu/index.php/AURA07-08_
Tests
- Calibration
- Testing
- Vertexing
- Concerns from last season
- DRM noise
- Elongation of signal
- Better ACU
38
Gain Measurement
- DRM 1
- Full Cluster DRM only
Gain (db)
Freq (MHz)
Freq (MHz)
39
Vetexing
- Cluster was spaced in the PSL production hall.
Antennas 3 m high.
40
Is the DRM quiet
- Screen chamber was built inside the old dfl
- -174 dbm/Hz thermal floor translates into -108
dbm/4Mhz. - DRM1 is watching DRM2
Gain corrected Average FFT Spectrum
Average FFT Spectrum
Ch 2
Ch 1
Ch 2
Ch 1
Ch 4
Ch 3
Ch 3
Ch 4
Low freq
Outside screen room
Outside screen room
Freq (4MHz)
41
DRM Response
Measured signal
Sharp Pulse in t
Frequency Response
Flat response Window 200MHz-900Mhz DRM
?
42
Tests left to do
- Antenna response
- EMI survey
- More Vertexing
- Complete Cold testing and calibration
43
The Bottom lineThis years clusters
- The new clusters are working well
- EMI noise needs to be carefuly measured. Tests
using DRMs and using calibration antennas and
scope indicates that the DRM are quite. - Antennas and cluster calibration in low noise
enviroment. - Cold testing and calibration before deployment
- ACU needs to be redesigned (too weak, too noisy)
44
AURA
In Ice Clusters 2 clusters were deployed last
year and are taking data. Is there a prospect
for Physics? What is our commitment to data
processing, analysis, calibration?
- Future Detector
- Design of a mini-GZK detector. Probably near or
at surface. - Is it going to happen?
- How active will UW be?
- Simulation, Hardware, concept
Next AURA deployment 4 clusters were built for
deployment this year. They told us no. Maybe
next year. Is the hardware good enough? What
is our commitment to testing, Calibration,
deployment?
45
Future plans
- Geometry
- What depth? How many stations? Spacing?
- Power? DAQ?
- Full/Partial readout?
46
Simulation
- Important for timing reconstruction.
- There are many simulations out there we need
one here.
47
Ray Propagation time
-10 m
-100 m
-600 m
-1400 m
48
(No Transcript)
49
Ray TracingThe bottom line
- Simulation is crucial for vertexing and for
geometry design of the next detector - Surface? Near surface? How deep? What spacing
between stations? Between clusters? - We need access to good simulation tools
- (I used my own hack for quick and dirty
stuff-this is not a full ray tracing or god
forbid neutrino Askaryan simulation, though it
can be worked on and improved, I doubt that it
worth the effort since there are more complete
tools out there.)
50
Ray Tracing
51
(No Transcript)
52
Shallow Cluster
Channel 1 Channel 2 Channel 3 Channel 4
Channel 1 Channel 2 Channel 3 Channel 4
- Forced trigger runs RMS 20-30 counts 22-33
mV - Triggered runs RMS 90-110 100-120 mV -
More noise on Channel 4
53
Shallow cluster
Channel 1 Channel 2 Channel 3 Channel 4
Channel 1 Channel 2 Channel 3 Channel 4
- More power in trigger runs than in forced runs
- Channel 4 more power
- Trigger runs show a peak near 200 MHz
54
Deep Cluster
Channel 1 Channel 2 Channel 3 Channel 4
Channel 1 Channel 2 Channel 3 Channel 4
- Forced trigger runs RMS 10-20 counts 11-22
mV - Triggered runs RMS 65-80 71-90 mV - More
noise on Channel 43
55
Deep Cluster
Channel 1 Channel 2 Channel 3 Channel 4
Channel 1 Channel 2 Channel 3 Channel 4
- More power in trigger runs than in forced runs
- Channel 34 more power - especially in lower
freq - Trigger runs show a peak near 200 MHz
56
Suitability of IceCube environment
- Channel and cluster trigger rates were compared
when IceCube/AMANDA were idle and taking data.
Channel 1 Scaler rate vs. Discriminator value
IC AMANDA on AMANDA off IC AMANDA off
- Noise from IC/AMANDA is enhanced in lower
frequency on a given channel/band. - Combined trigger reject most of this noise.
- Measurement only down to 200 MHz
band A (Lowest freq.)
band B (Low freq.)
band D (Highest freq.)
band C (High freq.)
Recommended
CrystalGraphics Presentations


